This is itNo much to say. This is going down very fast. Price is breaking down the falling wedge, and it has a lot of resistance above. Yo can short the ETF SOYB if the futures are too expensive.
ZSN2027 trade ideas

Nasdaq(NQ) and Soybean Oil/Meal had a nice inside day long setupnow price is above daily 18 moving average and its time to set stop below prior days low.
as you can see from backtest the strategy to go long above an inside day is very profitable...
Chiron in my 2nd house.There are cycles and trends to everything... a price chart is just a recording of this. There is nothing new in the market, there can't be, human nature does not change. Study past patterns, try to figure out where we are with-in that pattern. Plan, implement, monitor and adjust. It's simple, just not easy. Most things are completely obvious once you learn to see. The first step is for you to look. Refer to notes with-in the chart.

Soybean Futures ( ZS1! ), H4 Potential for Bearish DropTitle: Soybean Futures ( ZS1! ), H4 Potential for Bearish Drop
Type: Bearish Drop
Resistance: 1535.00
Pivot: 1514.00
Support: 1490.75
Preferred case: Looking at the H4 chart, my overall bias for ZS1! is bearish due to the current price being under the Ichimoku cloud , indicating a bearish market. If this bearish momentum continues, expect price to possibly drop from the pivot at 1514.00, where the 23.6% Fibonacci line is before continue heading towards the support at 1490.75, slightly below where the -27.2% Fibonacci expansion line is.
Alternative scenario: Price may head back up to retest the resistance at 1535.00, where the 61.8% Fibonacci line is.
Fundamentals: There are no major news.

Soybean Futures ( ZS1! ), H4 Potential for Bearish DropTitle: Soybean Futures ( ZS1! ), H4 Potential for Bearish Drop
Type: Bearish Drop
Resistance: 1535.00
Pivot: 1514.00
Support: 1490.75
Preferred case: Looking at the H4 chart, my overall bias for ZS1! is bearish due to the current price being under the Ichimoku cloud, indicating a bearish market. If this bearish momentum continues, expect price to possibly drop from the pivot at 1514.00, where the 23.6% Fibonacci line is before continue heading towards the support at 1490.75, slightly below where the -27.2% Fibonacci expansion line is.
Alternative scenario: Price may head back up to retest the resistance at 1535.00, where the 61.8% Fibonacci line is.
Fundamentals: There are no major news.

The Bollinger Bands are Squeezing the Juice out of GrainsSoybean short swing trade:
The Bollinger Bands width has narrowed to 2.56% of price which is a level not seen in over a year. A new 6-month or greater low in bandwidth indicates that a volatility squeeze breakout is likely upon us. Similar volatility squeeze situations exist in wheat and corn but they both broke to the downside significantly last week. Wheat was -6.42% on the week, corn -4.21%, and soybeans lagged at -0.20%.
Soybean price reached the lower parabolic SAR which is a signal to short the volatility squeeze. The stop loss is positioned at the upper SAR for this trade. A stop above the 20-day SMA would be more conservative.
The overarching price pattern is a rising wedge with what appears to be a fake breakdown in late January. If we hold below the 20-day SMA it will roll over in 3 days.
Wheat shows a similar setup already occurred a couple weeks ago but it was a head fake to the upside. There is risk in wheat being at the recent low pivot for the 3rd time. It could moon from here like gold did after making a triple bottom. Note the gigantic head and shoulders.
Wheat:
Gold:
Note the lack of a Bollinger Band squeeze at the pre-moon triple bottom:
Corn also shows a similar setup, but there was no head fake, it just broke down out of the band squeeze.
Corn:
Soybean Crush spread:
It appears positioned for a big move in either direction. Seems likely to bounce back up in concert with a soybean drop. It’s in volatility squeeze territory as well.
Oil:
The mother of all commodities has an inverse head and shoulders continuation pattern suggesting more downside:
tldr; short soybeans

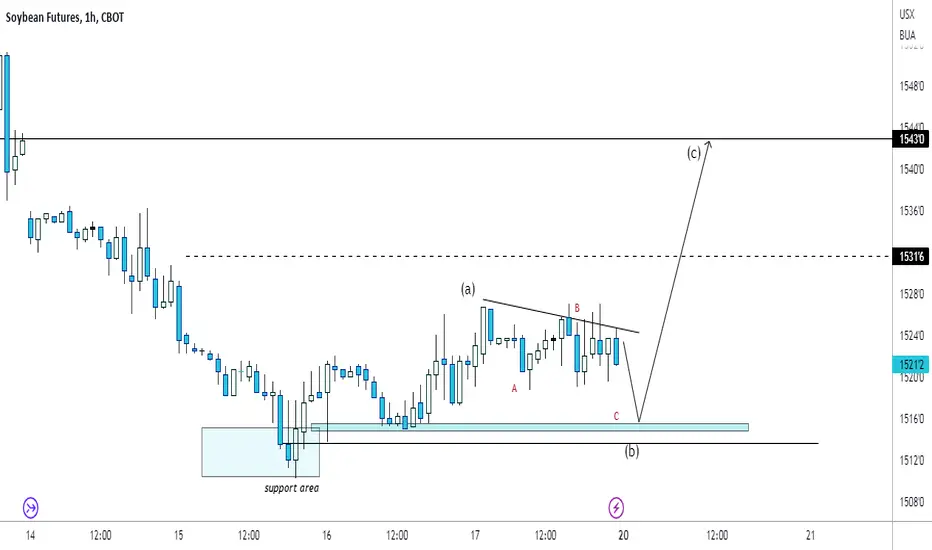
Soybean ZS1! Bullish forecastSoybean looks bearish for what looks like an ABC bearish move down to the support area for a bullish pullback up to 1531 with a bias of 1543
As above, so below.A fractal is a fractal is a fractal. A black cat told me over breakfast this morning.

TOFU FuturesI posted Cattle futures earlier, but I realize some of my followers may be vegetarian.
Tofu futures also trending up, and I would expect it to bust out to new highs if the Fed doesn't go .50% today. Inflation is not gone, just dipped like this chart did. Trend is once again UP, not down.
The Fed is incompetent and looks at trailing data instead of futures, so I think they screw up just like they did a couple of years ago.

Soybeans forming a head and shoulders patternSoybeans have proved itself one of the strongest commodities the past few months. As soybeans makes another leg up it looks like a H&S pattern could be forming. Set your alerts, this could a good trade!

Soybean Futures ( ZS1! ), H4 Potential for Bearish DropTitle: Soybean Futures ( ZS1! ), H4 Potential for Bearish Drop
Type: Bearish Drop
Resistance: 1535.00
Pivot: 1492.25
Support: 1457.75
Preferred case: Looking at the H4 chart, my overall bias for ZS1! is bearish due to the current price being under the Ichimoku cloud , indicating a bearish market. If this bearish momentum continues, expect price to possibly continue heading towards the support at 1457.75, where the 61.8% Fibonacci line is.
Alternative scenario: Price may head back up to retest the pivot at 1492.25, where the 38.2% Fibonacci line is.
Fundamentals: There are no major news.

Soybean Futures ( ZS1! ), H4 Potential for Bearish DropTitle: Soybean Futures ( ZS1! ), H4 Potential for Bearish Drop
Type: Bearish Drop
Resistance: 1535.00
Pivot: 1492.25
Support: 1457.75
Preferred case: Looking at the H4 chart, my overall bias for ZS1! is bearish due to the current price being under the Ichimoku cloud, indicating a bearish market. If this bearish momentum continues, expect price to possibly continue heading towards the support at 1457.75, where the 61.8% Fibonacci line is.
Alternative scenario: Price may head back up to retest the pivot at 1492.25, where the 38.2% Fibonacci line is.
Fundamentals: There are no major news.

Daily ZS analysisDaily ZS analysis
Sell trade with target and stop loss as shown in the chart
The trend is down and we may see more drop in the coming period in the medium term
All the best, I hope for your participation in the analysis, and for any inquiries, please send in the comments.
He gave a signal from the strongest areas of entry, special recommendations, with a success rate of 95%, for any inquiry or request for analysis, contact me

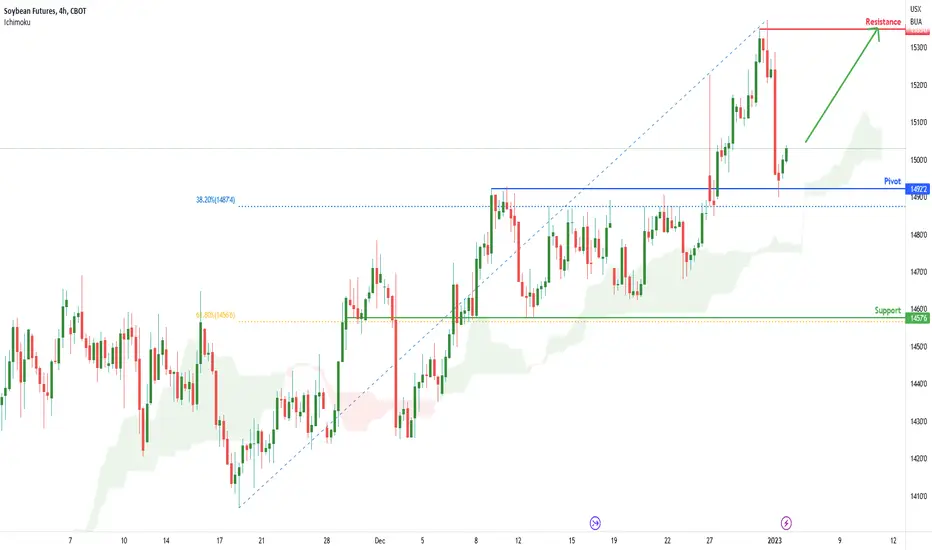
Soybean Futures ( ZS1! ), H4 Potential for Bullish ContinuationTitle: Soybean Futures ( ZS1! ), H4 Potential for Bullish Continuation
Type: Bullish Continuation
Resistance: 1535.00
Pivot: 1492.25
Support: 1457.75
Preferred case: Looking at the H4 chart, my overall bias for ZS1! is bullish due to the current price crossing above the Ichimoku cloud , indicating a bullish market. If this bullish momentum continues, expect price to possibly continue heading towards the resistance at 1535.00, where the recent high is
Alternative scenario: Price may head back down to break the pivot at 1492.25, where the 38.2% Fibonacci line is before heading towards the support at 1457.75, where the 61.8% Fibonacci line is.
Fundamentals: There are no major news.
ZS1! Potential For Bearish DropLooking at the H4 chart, my overall bias for ZS1! is bearish due to the current price crossing below the Ichimoku cloud, indicating a bearish market. Looking for a sell entry at 1509.00, where the 38.2% Fibonacci line is. Stop loss will be at 1537.50, where the recent high is. Take profit will be at 1465.50, where the 38.2% Fibonacci line is.
Please be advised that the information presented on TradingView is provided to Vantage (‘Vantage Global Limited’, ‘we’) by a third-party provider (‘Everest Fortune Group’). Please be reminded that you are solely responsible for the trading decisions on your account. There is a very high degree of risk involved in trading. Any information and/or content is intended entirely for research, educational and informational purposes only and does not constitute investment or consultation advice or investment strategy. The information is not tailored to the investment needs of any specific person and therefore does not involve a consideration of any of the investment objectives, financial situation or needs of any viewer that may receive it. Kindly also note that past performance is not a reliable indicator of future results. Actual results may differ materially from those anticipated in forward-looking or past performance statements. We assume no liability as to the accuracy or completeness of any of the information and/or content provided herein and the Company cannot be held responsible for any omission, mistake nor for any loss or damage including without limitation to any loss of profit which may arise from reliance on any information supplied by Everest Fortune Group.

SHORTPrice moving within the boundary of Ellipse 2
If price stays within this ellipse then terminus is again at 1800 in May before a correction starts.
However, giving the cyclic structure completing within the square price will continue to decline if it stays below 1557 usd.
First TP is at 1142 usd.
Trade safe

Soybean Weekly Forecast (January 3 – 5, 2023)Uptrend scenario
An uptrend will start as soon, as the market rises above resistance level 1530, which will be followed by moving up to resistance level 1555.
Downtrend scenario
An downtrend will start as soon, as the market drops below support level 1508, which will be followed by moving down to support level 1487 and 1462.

Soybean Monthly Forecast, January 2023Uptrend scenario
The uptrend continuation is not expected this month.
Downtrend scenario
An downtrend will start as soon, as the market drops below support level 1508, which will be followed by moving down to support level 1462, 1433 and 1400..

Soybeans bucking the bear trends in commoditiesSoybean fund SOYB was added recently as the seasonal is positive into next summer and the technicals have been constructive. Most recently it took out resistance, turning it to support.

Daily ZS analysisDaily ZS analysis
A long position with the target and stop loss as shown in the chart
The trend is up, we may see more upside
All the best, I hope for your participation in the analysis, and for any inquiries, please send in the comments.
He gave a signal from the strongest areas of entry, special recommendations, with a success rate of 95%, for any inquiry or request for analysis, contact me

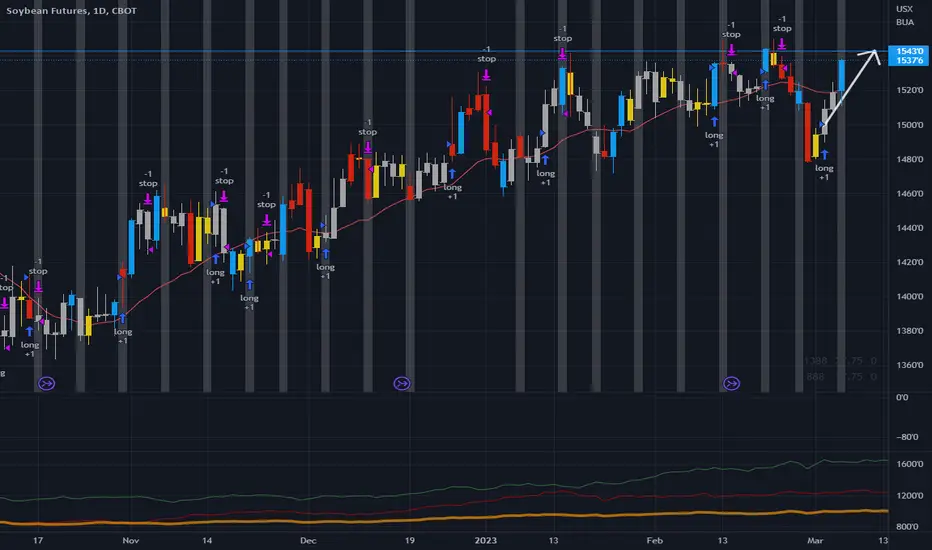
We've seen this blowoff top movie beforeBeans have topped in a similar way multiple times this year. Rallying hard and giving it back intraday for a terrible looking candlestick.
