#CHESS/USDT#CHESS
We have a bearish channel pattern on a 1-hour frame, the price moves within it and adheres to its limits well
We have a green support area at 0.1773 after the price touched it and bounced from it
We have a tendency to stabilize above moving average 100
We have an uptrend on the RSI indicator that supports the price higher
Entry price is 0.1830
The first goal is 0.1949
The second goal is 0.2000
The third goal is 0.2070
CHESSUSDT trade ideas

CHESS to print a 2000% move?On the above weekly chart price action has corrected 96% since late 2021. A number of reasons now exist to consider a long position, including:
1) Price action and RSI resistance breakouts.
2) Support and resistance. Price action prints multiple weekly candles on past resistance. Oh yes.
3) Regular bullish divergence. Multiple oscillators print positive divergence with price action as measured over a one month period. This includes money flow.
4) The falling wedge forecasts a 2600% move from the breakout point as measured from the lowest and highest touch-points (blue circles).
Is it possible price action corrects further? Sure.
Is it probable? No.
Ww
Type: Trade
Risk: <=6%
Timeframe for long: Yesterday
Return: 20-25x

CHESSUSDT IDEAHey traders hope you are enjoying our analysis. Now we are here again with a new trading opportunity. We will discuss today about CHESS
CHESS THE Falling wedge pattern Breakout Has Already Done in 8H Timeframe ✅
Expecting 30% Bullish wave in coming Day's 🚀

CHESSUSDT UPDATE #CHESSUSDT
UPDATE
Hey dear traders hope you are enjoying trading and analysis with our team. we are here to discuss about CHESSUSDT
Falling wedge formation in 12h time frame
In the case of upside breakout Expecting massive Bullish wave 🚀

#CHESS/USDT#CHESS
We have had a symmetrical bearish channel since July 2022
It was broken by moving average 100 upwards
We are heading to touch the downward trend of the channel as a first goal
Current price 0.1853
Second goal 0.3228
Third goal 0.5094
Which represents 280% of the current price

CHESS has a good potential To pumpTarget are there ... if it breaks the trend line it can pump like a moon or something.
but the support line it will be huge profitable if hit it

CHESS aims for higherCHESS has broken its downward trend line, and has completed 123 structure. This trade setup has very good upward potential and excellent risk reward.

CHESSUSDT IDEAHey traders hope you are enjoying our analysis. Now we are here again with a new trading opportunity. We will discuss today about CHESS
CHESS THE Bearish rectangle Breakout has Done in Weekly Timeframe✍️
Expecting 170% Bullish Wave📈

CHESSUSDT IDEAHello Traders Hope You Are Enjoying Our Analysis. Today We Will Discuss About CHESS
(Update)
The Falling Wedge Has Breakout & Retest In 3D Timeframe✅
Expecting Massive Bullish Wave Towards 1$ In Few Weeks✍️

CHESSUSDT IDEAHey traders hope you are enjoying our analysis. Now we are here again with a new trading opportunity. We will discuss today about CHESS
CHESS Finally Hits Our Target +60% Profit Done ✅ 💰💵

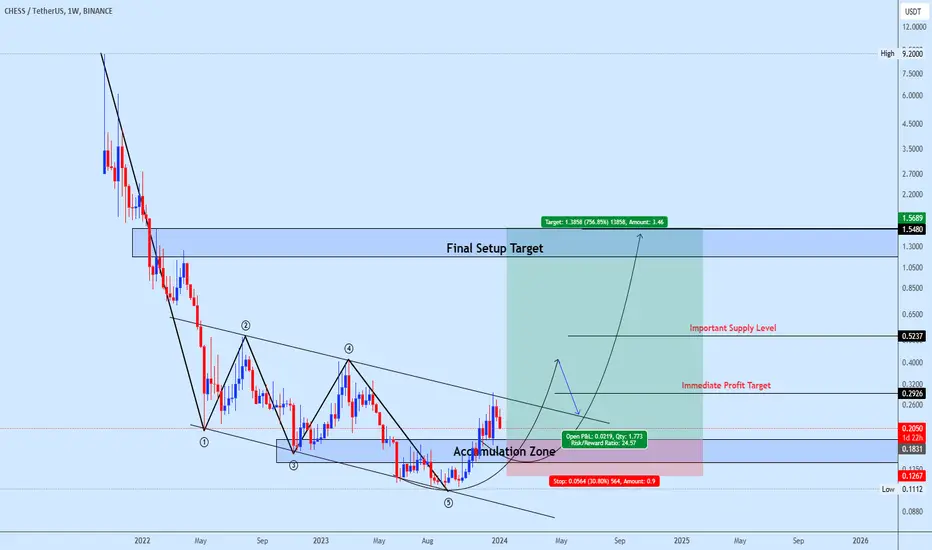
Chessusdt Trading opportunityCHESSUSDT appears to be trading within a descending channel formation, it seems to have completed a five descending legs. This observation gives us a strong bullish bias for the coin, as we are now anticipating a breakout to the upside in the near term.
To capitalize on this potential upward movement, we have identified a possible accumulation zone. This zone is selected based on historical support levels and the lower boundary of the descending channel, which traders may consider as an entry point for long positions. To manage the inherent risks of trading, we suggest placing a stop loss just below the most recent swing low within the channel.
Furthermore, we have outlined specific profit target levels on the chart. These targets are based on key resistance levels that could be encountered as the price ascends post-breakout.
Your engagement with our content is highly valued, so please remember to support our work by liking this post.
Thank you for your input and interaction.
#chess' pump must be insaneVery well accumulated during liquidation phase... So pump will be hard!
NOT FINANCIAL ADVICE.

chess undervalued token on binance market cap 45m on binance which is undervalued . I expect that chess will break 0.33 cent resistance. cup and handle target is 0,83 cent easy 2,5x nfa

CHESSUSDT Resistance Breakout!CHESSUSDT Technical analysis update
The CHESS price has broken its resistance trend line after 675 days of consolidation. We can expect a gradual upmove in CHESS in the coming days.
Buy zone : Below $0.33
Stop loss : $0.245
Regards
Hexa

♟️ CHESS - I want to play a game Tranchess is an asset tracking protocol that offers investors different risk and return profiles. Essentially, it uses a series of sub-funds, called tranches, to offer different return matrices from a single parent fund.
I think we will see $1 soon.

#CHESS/USDT - Long - Potential 27.71%Strategy: Long
Exchange: BINANCE
Account: Spot
Entry mode: Market order in range
Invest: Risk 1%
Exit:
• ⎿ Target 2 : 0.4033 26.82%
• ⎿ Target 1 : 0.3462 8.87%
Entry: 0.3180 ⌁ 0.3180
• ⎿ Current market price: 0.318
Stop: 0.2867 (-9.84%)
Technical indicators:
Cup and handle break (common this cycle), RSI momentum and resistance break.
• ⎿ 24h Volume: 9919246.98593
• ⎿ Satoshis: 0.318
• ⎿ Analysis: TradingView

CHESS LOOKS BULLISHIt seems that the large diametric has finished. Now it has entered a valuable wave.
It can move towards the TPs while maintaining the green range.
Closing a daily candle below the invalidation level will violate the analysis.
For risk management, please don't forget stop loss and capital management
When we reach the first target, save some profit and then change the stop to entry
Comment if you have any questions
Thank You

CHESS / CHESSUSDTGood Luck >>
• Warning •
Any deal I share does not mean that I am forcing you to enter into it, you enter in with your full risk, because I'll not gain any profits with you in the end.
The risk management of the position must comply with the stop loss.
(I am not sharing financial or investment advice, you should do your own research for your money.)

#CHESS will rocket, no doubt$CHESS #Tranchess long term chart is awesome, sooner or later it will hit the target i pointed on the chart.
NOT FINANCIAL ADVICE.

CHESSUSDT IDEAHey traders hope you are enjoying our analysis. Now we are here again with a new trading opportunity. We will discuss today about CHESS
CHESS Falling wedge Breakout Has Already Done in 1D Timeframe ✅
Expecting 60%Bullish Wave✍️

CHESS/USDT Gearing Up for a Bull Rally? 👀🚀 CHESS Analysis 💎Paradisers, turn your attention to #CHESSUSDT, as it's signaling a potential for a noteworthy move from a crucial demand level.
💎 #Tranchess is charting an upward course, indicating a likely bullish departure from its current demand zone. We're looking at a potential retest of the demand level at $0.17, with a significant supply zone on the horizon. If #CHESS holds firm above this mark, it may set the stage for an ascent toward the major supply zone at $0.26.
💎If #CHESS encounters difficulties in holding above the support level, a reassessment of our trading approach might be necessary. In that event, we would consider initiating a bullish movement from a lower bullish Order Block (OB).
💎Monitoring this level closely is essential, as dropping below it could initiate a considerable bearish trend.
💎Stay vigilant and ready to adapt, Paradisers. Your ParadiseTeam is committed to offering the latest insights and strategic advice, ensuring you're primed to effectively tackle these market developments.

CHESSUSDT UPDATEUPDATE
CHESS is making falling Wedge and this is ready for breakout. After this Breakout we can see gain upto 65%.

CHESSUSDT IDEABullish flag up side breakout is already done in 1D time frame
Expecting massive bullish wave moving as expected running in 50% profit so far
