CHFGBP trade ideas

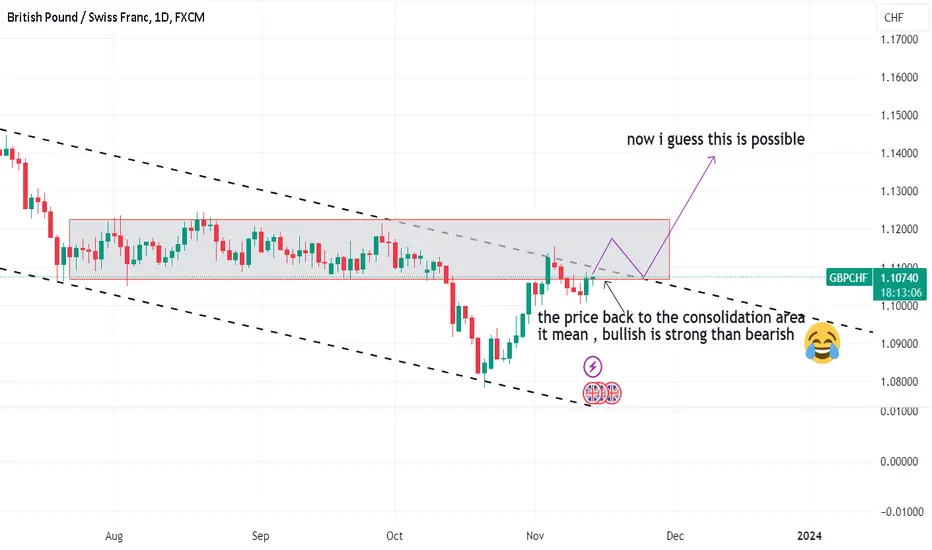
GBPCHF - Make Me Confusseedddddi think GBPCHF will back to bullish
but it so confussedd
what do you think guys,
please share your analysissss
dyor
disclaimer
WEEK 46 gbpchf If price stays under this zone i will be looking for more sells until the low is broken.

GBPCHF Sell.GBPCHF Sell.
Double Top with Buy Climax.
Ideally would like to see a Rejection at top of Range - but sometimes its missing.
Divergence.
3x move if it goes.


GBPCHF Shorts#This one is personal XDD
#REPOST
Market structure Bearish on Higher time frames
Potential Market will retest the strong Level of Support which held for over a year which was finally broken 2 weeks ago (The retest occurred and they took me out the first time)
There is a lot of rejection in the AOI
Entry at Daily AOI
Daily Rejection candles
Daily Head and Shoulder Pattern
Strong H4 Resistance
H4 Forming LHs
REMEMBER: Trading is a Game Of Probability
: Manage Your Risk
: Patience Pays
: Every Moment Is Unique
: Rinse, Wash, Repeat!
: Stay Hydrated
#Follow#Share#Comment#Boost
Weekly Outlook
Daily Outlook

GBPCHF short, TF=H2Price has returned to load zone marked by yellow square.
entry: now
TP: 1,09321
SL: 1,11606

gbp/chf bearishgbp/chf market has been bearish for a while in higher and lower time frames, we notice a strong trend line being respected, price has come back to a previous support zone which is now acting as resistance and the stochastic indicates market is over bought, i placed some sell positions here, we'll see how it goes!

GBPCHF Trade IdeaGBPCHF Trade Idea
Each zone acts as support (we buy upon confirmation) if the market is above the zone & each zone acts as a resistance (we sell upon confirmation) if the market is below zone.

GBPCHF: Looking like a fake out and drop to meI see GBP as continuing to be weak, poor GDP data last week, hikes expected to be over, and expecting to see some CHF strength.
BoE interest rates this week, but with the market expecting hiking to be over, I don't think it matters what happens, sterling will fall.
We saw a move above my descending trendline, seeing this as possibly a fake out - we've broken back through my support, now resistance line which would suggest a fall back down to recent lows here.

GBPCHF Long Term Buying Trading IdeaHello Traders
In This Chart GBPCHF DAILY Forex Forecast By FOREX PLANET
today GBPCHF analysis 👆
🟢This Chart includes_ (GBPCHF market update)
🟢What is The Next Opportunity on GBPCHF Market
🟢how to Enter to the Valid Entry With Assurance Profit
This CHART is For Trader's that Want to Improve Their Technical Analysis Skills and Their Trading By Understanding How To Analyze The Market Using Multiple Timeframes and Understanding The Bigger Picture on the Charts

GBPCHF IdeaTechnicals:
We can see price has created a resistance a left a clean top, pairing this with the MACD showing bearish weakness and DSS heading into 'oversold' territory I expect a pullback to test resistance again, forming a double top.
Economics:
The GBP has been one of the worst performing G10 currencies, a real change is required by the Sunak Government in order for investors to view the GBP in better light. The CHF has been performing and holding it's ground much better compared to the GBP. This is a clear weakness vs strength trade.

Short OpportunityIf the market closes below 1.10, I will likely take a short position with a stop over the high of 1.1058. I'm expecting some sideways movement before we see a significant break. Major news is expected on Tuesday, and we will probably see even bigger movements in the middle of the week.

GBPCHF - long trade ideaGBPCHF
My perspective on GBPCHF
4 hour - As we can see price couldn't break the swing low, and started an uptrend. And then broke the swing high which is a major support and resistance level. The pull back came down to retest this level as well as the 50 EMA.
As a mentioned in the previous analysis, we should have to wait for this candlestick formation on the higher time frame.

GBPCHF - TIME to DEEP !this analysis just base on basic technical analysis
i can't explain much
i just take a short
because break support.
disclaimer.
how you guys see?
same with me ?

gbpchf sell trade- The GBPCHF pair has been in a downtrend since the beginning of October, when it reached a high of 1.1235². Since then, it has been making lower highs and lower lows, forming a descending channel on the 4-hour chart³.
- The pair recently broke below the 50-period exponential moving average (EMA) and the 1.1100 support level, indicating a bearish momentum. The 50 EMA is now acting as a dynamic resistance, while the lower boundary of the channel is providing a potential target for the bears.
- The pair is also trading below the 200-period simple moving average (SMA), which is another sign of a long-term bearish trend. The 200 SMA is currently around 1.1150, which coincides with the 61.8% Fibonacci retracement level of the last major swing up from 1.0985 to 1.1235². This level could act as a strong resistance if the pair attempts a pullback.
- The relative strength index (RSI) is hovering around the 30 level, indicating that the pair is oversold. However, this does not necessarily mean that a reversal is imminent, as the RSI can remain in the oversold or overbought territory for a prolonged period of time during a strong trend. A break above the 50 level would be needed to signal a possible change in the momentum.
- The stochastic oscillator is also in the oversold zone, but it has not yet crossed above the 20 level, which would indicate a bullish divergence. A bullish divergence occurs when the price makes a lower low, but the stochastic makes a higher low, suggesting that the selling pressure is weakening. A bullish divergence could be a sign of a potential reversal or a correction.
- The MACD histogram is negative and below the zero line, confirming the bearish bias. The MACD line and the signal line are also below the zero line and moving further apart, indicating an increase in the bearish momentum. A bullish crossover of the MACD line and the signal line above the zero line would be needed to signal a possible shift in the trend.
In conclusion, the GBPCHF pair is in a bearish trend, and the technical indicators suggest that the trend is likely to continue. The pair could face some resistance around 1.1100 and 1.1150, but the overall outlook is bearish. The pair could target the lower boundary of the channel, which is currently around 1.1000, or the next support level at 1.0985. A break above 1.1200 would invalidate the bearish scenario and indicate a possible reversal.
Source: Conversation with Bing, 10/11/2023
(1) GBP CHF Chart - Investing.com. www.investing.com
(2) GBP to CHF — Pound to Swiss Franc Rate — TradingView. www.tradingview.com
(3) 1.00 GBP is equal to 1.10 CHF. bing.com
(4) GBPCHF Chart - Live Forex Rate - Live Charts. www.livecharts.co.uk
(5) British Pound to Swiss Franc Exchange Rate Chart | Xe. www.xe.com
(6) GBP/CHF Price Chart & Exchange Rate History - eToro.. www.etoro.com

GNPCHF H1 ANALYSIS NEXT MOVE You can see all the important Zones and levels on the Chart 📉
We except the price to test the Bearish order block and then fell
It is honor to share your comment with me

Buy now!We are set for a buy. Price mitigated our 4 hour demand and smaller timeframe and flipped to a bullish momentum.

Update on GBPCHF, bearish move
The price break our support level at 0.88717, so from this point i expect the price to continues to fall up to
0.87876 levels;
And from this 0.8776 level that stands as our first target, i expect a retracement above the breakout level to the point of 0.88717 to offer sell.
And from this new selling zone we will see a very strong bearish move to the level of 0.87238 or 0.8635
#GBPCHF SHORT!!
tp 1.09730
tp 1.08469
tp 1.07064
sell @ 1.10914
limit 1.11226
stop loss 1.11591

GBPCHF LONGSTrendline break to the upside
Rejection within daily OB aligned with Fibonacci retracement
Target is next resistance

$GBPCHF ShortDaily Timeframe:
Is extremely bearish.
we have H4 bearish as well
We have price drawing to H1 FVG AND BREAKER Hence a unicorn setup.
Price has take liquidity on both sellside and buyside in M30 Timeframe.

GBPCHF BUYPrice is in our demand zone and it has taken liquidity (trendline) so price has potency to rise now.
Please support and follow for more analysis.

GBPCHF: 09/11/2023:🔴sell opportunity🔴You can see all the important zones and levels on the chart.
We expect the price to test the bearish order block and then fall.
we need LTF confirmation for entry.
💡Wait for the update!
🗓09/11/2023
🔎 DYOR
💌It is my honor to share your comments with me💌
