looking to short australia dollar shorting aux dollar. price is in a correction pattern, wave (A) and (B) already formed .
wave (C) = wave (A) *0.618% at 5911 which is also around 38.2% Fibonacci level.
AUSTRALIA200CFD trade ideas

Technical Analysis Education - Simple TA on Weekly Chart - XJOTechnical Analysis Education:
ASX200 (ASX - XJO) Weekly Chart
For those of you out there who are new to trading, I like to keep my TA simple and clean. I also like to look at the bigger picture to understand what's happening right now. There can be a lot of confusion when an event such as a market crash happens. We can be reactive and emotional, which is normal, but not helpful.
See below the #XJO which tracks the ASX200. On the weekly charts its a clean upward channel, going through from the end of the GFC to now. Strong bullish trend with healthy pullbacks (corrections) You will note that the points value moves within this channel, bouncing as it goes.
Some points to note on the chart:
1. We are still in a #bullish market trend on the weekly timeframe (exclude the smaller time frames)
2. We haven't broken any major support levels.
3. We can expect to keep falling at least another 6% to said support.
4. We are still within the key #fibonacci levels of 38.2, 50 and 61.8. These are healthy retracement levels.
When to be concerned?
If we broke through our trend lines and fell below 5,800 points, we could potentially fall to 5,000 points or lower.
Make sure to look at the big picture!
Hope this helps

The XJO Corrections are Quicker, as Interest Rates head to ZeroAs interest rates head to zero the bounce backs from corrections are getting quicker.
XJO is in a 10 year uptrend channel since the GFC and the first correction in 10/11 from top of channel to bottom was approx 426 days at 23%, the second correction in 15/16 from top to bottom was approx 285 days at 21%, the next major correction in late 18 ( wasnt from top to bottom of channel) lasted approx 104 days at 15%. Current donwtrend has started from top of channel. As interest rates get lower from 5% to 0.5% the corrections seem to be less time.
Higher Probability we bounce off the 61.8 fib level or bottom of channel.

High Probability Of Dead cat bounce at 6300 ?6000 is the next level of support, if not we head straight into a bear market to 5400, which i think is a lower probability!

AUS200 Long Buy the Dip1h Chart shows price to be reversing with confluences: broken bearish tl, set new higher high and higher low, support at 1h 50ma, support at previous resistance area. Targeting the 127% and 161% in extension

XJO monthly and weekly levels.Keeping it simple.
Monthly resistance @6618--> next test: More outbreaks, Geopolitical tensions, Lower forecasts, supply chain issues, Profit taking, Uncertainty
Strong support @6380 --> Thanks to : helicopter money(eg- Hong Kong), Interest rate cuts, ' Buy the dippers' .
Not a trader(yet). Purely sticking to fundamentals of the companies I own/want to own.


ASX 200 Index is expected to cut deep into negative territoryThe Index is expected to fall to around 6482.50 and 6409.00 in today's opening trades following the continues sell-off in the U.S. and European markets.
The Index slipped below 6711.00 a critical price point highlighted in my previous update and closed yesterday's session at 6651.40.
The Index has slipped into the next stage of this sell-off at 6711.00 and 6409.00 price range. Critical price level to watch in today's session is at around 6482.50 and 6409.00

AUS200 (S&P/ASK) (SELL MEDIUM TERM)I know this is slightly late, however this trade is active on my side and i am looking to take profit from the start of this impulsive leg. At around 6964.92 area, i will be looking to trail my stop to 7123.57 and continue from there in order to try and capitalize on this move down!

XJO ASX200, close above 20 MA (weekly) to be bullish againThe retracement that I was waiting for came this week and we went down fast and hard.
This has made me more bearish than before in the short term.
We could see an "exit pump" in the next few trading sessions by big investors/institutions and have the price level jump back toward the 20 moving average before going down further like the past. Therefore, for me to turn bullish on the Australia market again, I need to see the price level close above the 20 moving average on the weekly . "Green line" (around 6900-7000).
If we break the 50 MA yellow line:
-I will close all my open positions
-Be out of the market
-so I can buy great companies at a discount once this is over.
-I will be watching that box around 6300-6400 as the first level of support.
#cashisking. #warrenbuffet #valueinvesting

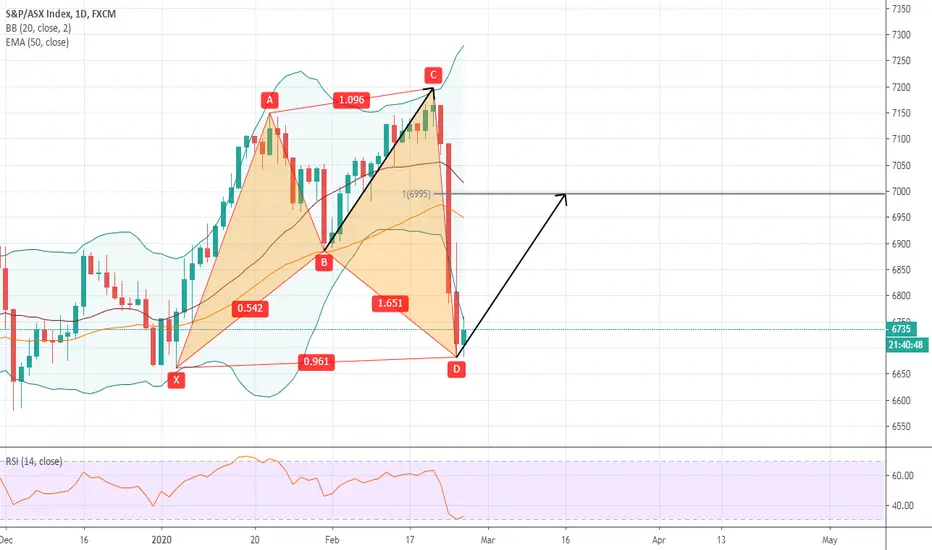
AUS200 Daily Harmonic Shark Pattern into Possible 5.0 patternAlready long, low risk high R:R trade, target to start adding to my longer term short is around the possible 5.0 pattern completion
Stop is directly below the last two days lows, not giving it much room as it will either retrace now or if it fails it will likely breach the lows to take out stops first and there is always another opportunity to get back in later
Alternate AB=CD zone shown by the copied arrows
I love large bars as it shows all of the orders are flushed out of there so moving back through them is so much easier...
S&P ASX 200 (XJO): Expect another -2% dive in today's session.The Index fell more than -2% in yesterday's opening trades and took out three support price level as predicted before closing above 6837.00. Today's session is expected to take another dive in the opening trades to around 6752.40 and 6711.00.
6711.00 is a critical price level which could determine the next level of this sell-off, if it fails then we could see the Index enters the next stage which is estimated between 6711.00 and 6409.00

S&P ASX 200(XJO) is expected to dive more than -2%The Index is expected to fall more than -2% in today's opening trades following the sell-off in the Europen and the US trading session.
The Index fell and close -2.25% in yesterday's session and suffered one of the worst trading sessions in months. The continuous spread of coronavirus spooked investors and created a mass exit into safe-haven assets which could continue to drive the stock market into a sell-off mode.
The Index is expected to fall to around 6837.00 and fluctuate at approximately 6896.00 and 6924.90.
Critical price level to watch on this chart is estimated at around 6924.00, 6896.60, 6837.00, and 6752.40

Short the fib retracementGold +1.57%
VIX +6.5%
Coronavirus Live Updates: Italy Locks Down Region After Spike in Infections nyti.ms
Coronavirus Spreads Outside China as Worries Mount www.wsj.com
ASX is reacting too, to get in on the downward movement we have to be a bit more patient though, wait for some retracement from the shock.

Second test of resistanceWhile the week had a strong bullish theme the second test of resistance has failed for now, also there is a notable risk theme divergence between currency and stock market strength - potential double top setup. Coronavirus, market sentiment, fundemental data release - see how the market digests. While AU exposure to Asian business is higher than the US and ASX generally follows global risk on trends today it was the opposite, while Nasdaq and Dow dipped the ASX edged higher. Another interesting observation is that most market players were confident buying into the closing bell hour to hold their positions over the weekend.

XJO - zoom in for the details?short! XJO. big 10 year trend vs small 4wk trend (way too steep to hold).
short short - will plummet follow break of 7135.
down to 7060
then review, for full drop to purple resistance line!


Australian Equities Unwind We're calling it.
Australian Equities have now recovered losses stemming from the 2008 Subprime Crisis sell off and are now at ATHs supported by large corporate buybacks amidst moderate earnings growth.
Our view
- Weaker relative EPS on the back of domestic bushfires, lowered Chinese demand and corporate buyback continuity.
- Lowe & Co running out of monetary stimulus and room to push asset prices higher. We see an unwind on any hawkish commentary out of the RBA.
We see weak price momentum and signs that price is now overbought and due in for a positional correction.
We have added sellside exposure across both our macro and directional portfolios
-------------------------
We look forward to continuing to provide market leading analysis to traders & investors alike across the TradingView platform.
Like, subscribe and leave your comments below!
Until next time,
Portier Capital
Macro Strategy & Portfolio Management


Short term ABC Correction For XJO ASX 200I am expecting an ABC correction in XJO in the short term.
I think we are about to see the start of a C wave this week unless we can break that trend line.
MACD indicates a " sell " signal.
At this stage, I am still bullish in mid to long term as long as we can STAY above or inside the triangle + above the 50 MA.

