Don't believe the hype. ASX ShortWhy are people buying stocks today? Are they bored?
Walk around outside, it's a shitshow.
Sell this madness. TRADE ACTIVE
AUSTRALIA200CFD trade ideas
XJO - ASX200If you assume that the economic fallout with COVID-19 will be worse than the GFC, and this is where we are today - 24th March, 2020:
- infection rates in Australia and the U.S. are still spiralling;
- all restaurants, bars, cinemas and large public spaces are closed, as are our state borders
- our national borders are closed;
- despite self isolation being mandatory, some people are ignoring it;
- there are no advanced precautionary measures being implemented, as in Singapore (for example), where they diligently use temperature guns and tracing apps;
- our schools are still open in most states
The fallout from the above is yet to be felt or accurately estimated.
With the GFC, the ASX200 fell more than 50% - we are still a long way from that number now.
I hope and pray we get through this and come out the other side in good shape and in the shortest time possible.

When will the Bounce happen? ASX The market looks like in complete meltdown, but for the short term the market is due for a bounce.
38% drop from peak to trough.
Indicators: RSI, BFI, StochRSI overdone Though StochRSI still showing time for more downturn. So looking at a 2 week timeframe for that bounce which should be about 20%.
But the weekly moving averages lets us know we are at the beginning of the fall.
If we look at 2007-2009 there was an original drop of 26% that took about 5-6 months. This current drop about 1 month so 5-6 x quicker. Than we had another 46% drop that took 9-10 months.


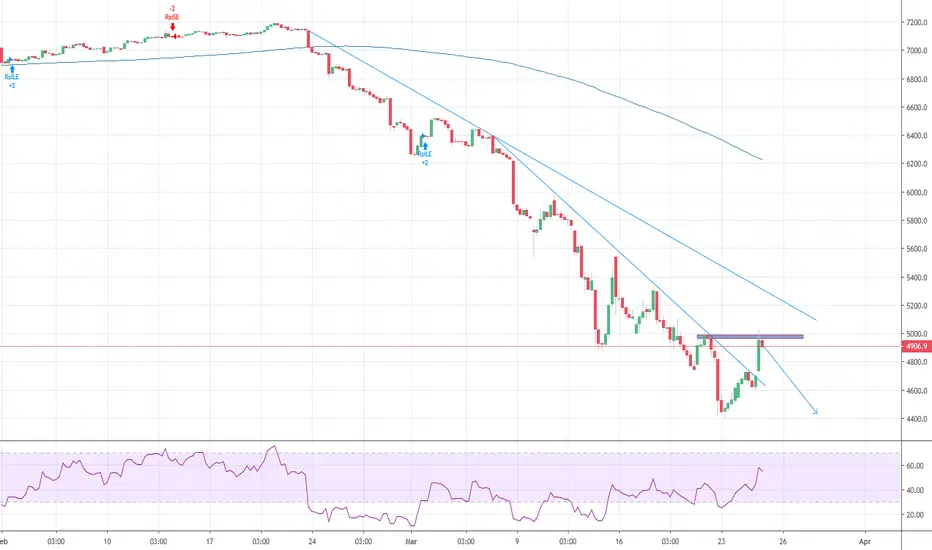
Descending wedge with indicator divergenceDescending wedge on H4 with divergence across all indicators. Could be primed for a little bull run.

My worst case scenario for ASX200 $XJO Hello investors and traders,
Warren Buffett famously said,
"Be fearful when others are greedy and greedy when others are fearful." I have seen this quote everywhere on social media last few days/week.
Retailer investors are being so GREEDY right now and buying stocks because it is cheap...This tells me we are nowhere near the bottom.
Learning from bitcoin, market bottoms when people are in depression and give up on investing because they are scared or have no money left.
As mentioned last week, we need to close above the 200 MA LOW on the monthly chart in order to have a chance of a quick recovery (4885).
Currently we are below this line, so let's prepare and assume we have close below this.
Here is my WORST CASE scenario for ASX 200.
We start the 3-9 TD sequential correction phase and head towards 2500. The catalyst for this to happen is an Australian recession or even a depression.
What would you do if this is the case? What are you going to do to protect your portfolio/wealth?


XJO Bearish Price Objective From The Recently Completed Top.XJO top pattern as well as bearish target as shown on the chart is for EDUCATIONAL PURPOSES ONLY.

ASX 200 in a descending triangle pattern ASX 200 as the possibility of being pushed back after hitting overhead resistance on the descending triangle. If the price pushes below the bottom support then increase position size as a significant move down is likely.


Weekly look at ASXThe ASX has historically moved in the large cyan ascending channel since the 1980's, which even held during the GFC in 2008.
This was broken to the downside in June 2015, and its final rejection of this line has led to the latest declines. During that time price has been propped up by a trendline formed from the reaction low from the GFC bottom.
Possibly a false floor created by government stimulus. This line formed the bottom trendline of an ascending wegde which has now broken down, with a target of around 4300.
Price is currently testing the EQ of the trading range that started in early 2000 and ran the whole decade. If we dont get a weekly hold of this EQ around 4900, we should target the bottom of the channel at 3450.
Will the new decade from 2021-2031 continue sideways in this trading range or will we create a new trading range for the new decade.
If we break down this trading range, this could be the dark decade of financial deleveraging that was always on the cards.
Or this could be reaccumulation, and we see a spring into a new global financial paradigm??


XJO ASX200 update -Pay attention to the 200 MA low monthlyGood morning,
I want to show you an important trading indicator today and it is the 200 moving average low on the monthly. (currently at 4885)
This indicator acted as major support during the GFC (Nov 2008, Mar 2009) and we tested this level last Friday and bounced strongly.....
I will wait and watch the monthly close to see if this is an excellent buying opportunity from a risk/reward strategy.

XJO aka ASX200 bounced on 200 Monthly MAThis chart shows my view on the different targets levels in terms of fibs extensions if ASX doesnt plunge again. I will set up my take profit as well as my reentry after each fib level is taken. So far we didnt get any sign of market reversal I will keep an eye on the chart and will update you as soon as I notice anything interesting. Also though past performance doesnt indicate future result we can see that in 2008 the market bounced on the same 200 Monthly MA.


AU200 Sell Continuation?AUS200 now is retracing.
After the confirmation today we will see, probably a good trade this month.

Next stop for the XJO?Clearly the uptrend since the start of the current bull market in AU (2009) has now been broken. The COVID-19 is taking it's toll on markets around the globe. We still do not know the full extent of the financial impact and markets are attempting to price this impact in now. Clearly for the ASX and many other markets there is no end in sight for the bloodshed. As for the XJO (ASX top 200 index) the next stop seems to be the 50% retracement level since the 2009 run and also the next level of significant and psychological support, 5000 points.


AUS200 - KEY POSITIONThis is a key position. Shorting this means that one is willing to take a controlled affordable loss above the amber ATR line (there is no formula to work that out).
This is a trend following set up - so there are no targets.

Aussie stock market - ABCDABCD correction of doom.
I will be looking to enter a SHORT position at the upper trend-line channel resistance between FEB-APRIL 2020.
Why FEB-APRIL 2020?
The duration to get from A-C gives us the answer....
If: A to C = 0.618 (2,191 days)
then: B to D = 1.272 (4,509 days)
The above calculation gives us D's position on approx. - 9 March 2020


XJO ASX 200 Index crushed in today's opening tradesThe benchmark was crushed in the opening in today's session down by -4% at the time of writing, looking to hold at 5985.00 support level in the 30 minutes price chart. This is a classic dead cat bounce, which we saw prices bounced off temporarily and pushed back down, continuing its downtrend.
The Index could continue further down to its next major support at around 5795.20 if it fails to hold at 5985.00. Another major support to keep an eye which is picked up by my longterm indicator is at around 5379.30

ASX200 $XJO Are we heading for a bear market? Good Evening, investors and traders, the Asx200 $XJO went lower again due to market uncertainty with the coronavirus.
Last week, I said if we breach the 50 moving average, the first level of support is around 6300-6400.
The market went straight down to 6259.9 on Monday and traded sideways between 6259-6500 for a few days and eventually making a new low of 6216 at Friday's close.
Next week, I am watching 5800-6100 as a very important area of support. (Currently, I do forecast a dead cat bounce from there)
Furthermore, the ASX200 $XJO must close above or near the 200 MA (red line). If not, we are more likely heading for a bear market.
One important thing to keep in mind is that the VIX is at a bearish high reading.
This tells the mid-large fund organizations such as investment banks and hedge funds to reduce risk and exposure in their long/short portfolios.
The good news is that we do have a TD 9 coming for the Vix and this signal a likely top for the short term.
Therefore, like the hedge funds and investment banks,
I am still only risking a small amount of money in the market. I will go big again WHEN the Vix is below 15 and price level can close above all moving averages. At the moment this price area is around 6666-6800.
Glossary:
VIX
The S&P/ASX 200 VIX Index ( XVI ) calculates the amount of volatility expected in the market over the next 30 days.
• High readings indicate uncertainty ( bearish ) 20-30
• Normal readings suggest a slight bullish bias 15-20
• Low readings indicate low volatility ( bullish ) and strong investor confidence. <14.99
Bear market
A bear market is a condition in which securities prices fall 20% or more from recent highs amid widespread pessimism and negative investor sentiment.
