Btc probable scenarioBitcoin harmonic analysis perspective with 10% growth in November and 30% loss after.
BTCX2020 trade ideas


20221022 internal FVG to outside BOS, test if it work (backtest)This is backtesting record. check internal FVG to outside BOS, test if it works (backtest)

BTC Daily Model This is my parameter model
lot of air between us and 13k if we pop up one more time
Think its unlikely but prepared for it
I just don't see the sell event
but they are never that obvious
Maybe Sam crashes the Market hard for us roasting him on twitter
for that front end Kyc stuff
absolute Grifter
The next rally will be hated due to
the fact people got so bearish here regardless
You can long scalp BTC
if you're smart enough to tp

BTC is @ DO or DIE territory$BTC @ DO or DIE
Like #BTC volume from a few days ago
Would convince if BREAKOUT was with similar volume
It is good that volume the last few days is light
However, any upcoming move should be with heavier than normal volume, hopefully to upside!
Not sure why the arrows didn't line up but they are pointing at the more than normal buy volume
You won't see this on SPOT
#bitcoin #crypto

BTC Bullish Cypher Update #3: A Falling Wedge AdditionSince first identifying this Cypher on the weekly I have noticed that BTC seems to have been trading within this huge Falling Wedge and now this week after bouncing up from a much Smaller Daily Timeframe Bullish Shark for the second time, it is attempting a weekly Breakout of the more prominent Falling Wedge.
The Measured Move for this wedge breakout would be around a $29,580 upside move to which would take us very close to the 61.8% Retrace from high to low at $49.6k.
We currently have Multiple Harmonic Supports between $18.5k and $17.5k along with an Equally as strong Price Action Support Floor at around $18.5k based off of some weekly candle closes we got in 2017 and in 2020.
A screanshot of the much smaller Daily Bullish Shark can be seen here on the CME chart but can also be seen on the Bybit chart underneath the CME screenshot in the Related Ideas tab below:

BTC futures show much more buy volume than spot Bitcoin2/
Spot $BTC volume on 13th ended up decent but NOT heavy as it was for futures #BTC
NOT CALLING BOTTOM BUT this = good for #bitcoin case
Last time it looked good, BUT LACKED VOLUME, was the green highlighted area
Still has LONG way to go but 1st time we see some accumulation
Keep in mind that we called WARNING SIGNS on BTC on October of last year!!! Documented!

BTC futures show much different signs vs spot1/
$BTC shows great potential & #futures show accumulation vs Spot #BTC which shows NOTHING
We've proven MANY times how derivatives dictate #bitcoin price action
HOWEVER
We're @ crossroads
This will prove once & for all if spot or futures dictate & case will close
More coming

BTC1...D= Bitcoin analysis on today's chart
The analysis is based on trend analysis and technical models
= The price is inside a descending channel. form a triangle pattern
== If the break is achieved in front of him, he has two selling goals

BITCOIN ACCUMALAITION PHASEI'm sharing my idea. What you guys think.
I THINK BITCOIN ON CME FUTURES CHART IS CLEARING IN ACCUMULATION STAGE.
I think Spring is in.


BTC - Just hit our resistance againAnd as we expected CPI was not as bad as expected and due to the downtrend we had the pop back up today (refer to previous post for this analysis). Now we are at our downwards sloping resistance (black trend line). It is possible we get a wick up to our red trendline, but it looks like the bullish momentum has stalled out. If we are able to close a daily candle above both these trendlines then the bottom could really be in, but as we sit right now, btc will be going back to $18,500 very soon and then looking to potentially break down from this bear flag.

Different look on BTC volume todaySo you understand how HUGE this is!!!
This will likely be the 2nd LARGEST BUY
volume day in years!!!!!!!!!!!!!!!!!!!!!!!
🚨ALERT! 🚨
MONSTER $BTC REVERSAL
&
While there's SOME short covering
it's minimal, so it's PURE BUYS!!!
We could be seeing BOTTOM in #BITCOIN TODAY!
We've not called one this year
Some were close but this is BIG!
Spot #BTC volume normal = IRRELEVANT
#futures dictate

HUGE $BTC SIGN today! We may change long term bear stance 2day!THIS IS HUGE!
MONSTER REVERSAL
&
While there's SOME short covering
it's minimal, so it's PURE BUYS!!!

30k for Bitcoin this fallDouble bottom with massive divergence.
From below there is no liquidity left to fall down.

BTC - CPI coming at pivot pointThe CPI numbers will be released in about 30 minutes. What is so interesting is we are literally at the most crucial point in the trend right before these numbers come out! On our most recent dump we have found support again at our bear market low on CME ($18,500). This of course means one of two things. 1. The numbers are better than expected and we get yet another rebound off this level to retest our trendline of resistance which right now sits at around $19,900-20k on this chart. Then we could potentially look to breakout. 2. The numbers are bad and as it look like the fed won't pivot, we break the $18.5k level on CME and start the capitulation we have all been waiting for.
My take. Since we have already started a downwards move and we are in the spot that we are, I think the CPI numbers will be better and we get a bullish move up. If I was just looking at the chart without having the CPI numbers affect me I would be longing here. Therefore at the moment my bias is to the upside, but I am happy to catch the capitulation to the downside if the numbers are worse. Good luck.

A break of local lows on BTC CME I am looking for next leg downA break of local lows on #BTC I am looking for next leg down 13170 - then lower to fill all CME Futures gaps
Big move incoming on the pinch of downtrend mid/linear regression, fib & daily 20ema
Get above & hold that 3day 20ema & I would look to pivot
_________________________________________________________
This content is for informational, educational and entertainment purposes only. This is not in any way, shape or form financial or trading advice.
Good luck, happy trading and stay chill,
2degreez

$BTC - CME Macro 3D Elliott Wave Update $BTC - Macro Chart. Ending diagonal is starting to print out on the larger TFs. The most harmonious chart I've found is on the 3D where you can imagine the curving towards the end of C. Lots of confluence for a bounce just around 17k, including a gap from late 2020, previous resistance all the way back in 2018 and more recently, a bounce from late 2020 once again.
fib extension with those numbers gives us a 1.618 target for wave iii around 125k. This is obviously all very hypothetical and will need to be re-evaluated once the bottom is found, if it hasn't been found already.
This is my main macro count. I have an alt count where the correction could span a few more years (this being only wave C of A).
Trade safe.


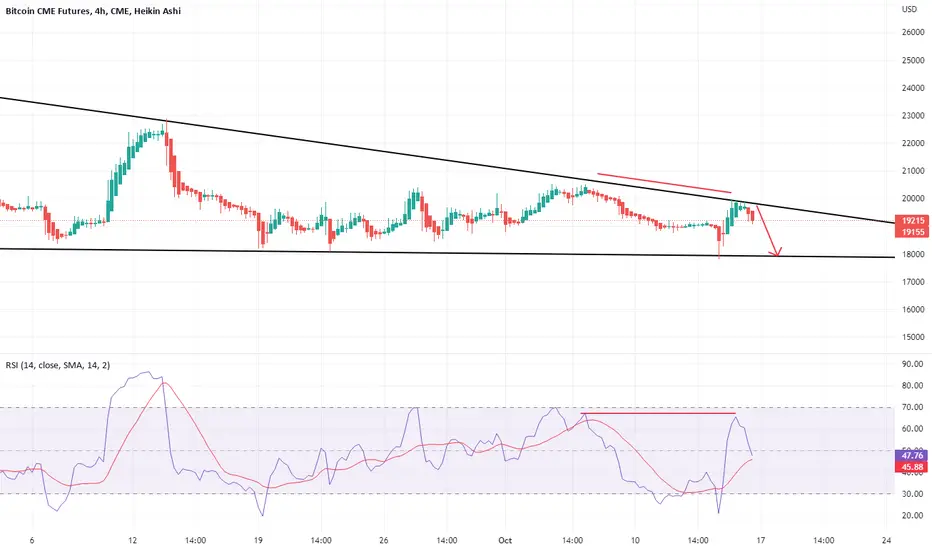
Bitcoin continue with the DowntrendOn Bitcoin is nice to see strong sell-off from the price 19970 , there are nice to see strong volume area....
Where is lot of contract accumulated...
I thing that sellers from this area will be defend this short position...
and when the price come back to this area, strong sellers will be push down the market again...
Downtrend + Strong volume area is my mainly reason for this short trade....
Happy trading
Dale

bearflag completing we may wind up below 17kthe signal moving average daily is telling us any touches are sell until we break into green teritory. if weekly bearflag completes im looking at below 17k by december futures.

Did bitcoin come close to the endgame ?will bitcoin survive after this range ?
high probability to break the level 18265, if that happened 80% the market will touch level 12475
CME:BTC1!
