BTC futures gap filled. Which gap is next?Btc daily futures gap filled. Still have gaps above and below current price. Which way next?
BTC1! trade ideas


BTC1 Gap fill to $29kim calling it now most gap fills are filled in a bearish sentiment... looking for a move up in the next weeks or earlier as well as being over sold around 31k

Downside Risk for $BTC Still ExistsJust a timing chart to use as a guide, which still signals a possible September low possibility.
Fibo

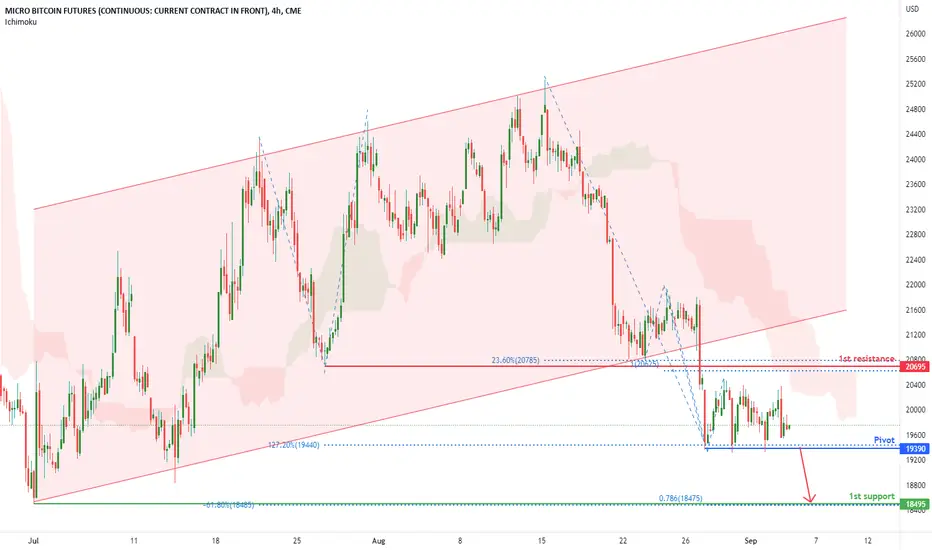
MICRO BITCOIN FUTURES (MBT1!), H4 Potential for Bearish DropType : Bearish Drop
Resistance : 20695
Pivot: 19390
Support : 18495
Preferred Case: On the H4, with price breaking out of an ascending channel and moving below an ichimoku indicator, we have a bearish bias that price will drop to pivot at 19390 where the swing low support and 127.2% fibonacci extension are. Should price break pivot structure, we would expect bearish momentum to carry price to 1st support at 18495 where the swing low support, -61.8% fibonacci expansion and 78.6% fibonacci projection are.
Alternative scenario: Alternatively, price could rise to 1st resistance at 20695 where the pullback resistance, 100% fibonacci projection and 23.6% fibonacci retracement are.
Fundamentals: After Fed Chair Powell reiterated that the Fed will tighten policy to bring down inflation , we have a bearish view on Bitcoin .
SHORT BTC FOR NEXT LEG DOWNwe are currently failing the "bullish wedge" pattern and is gunna send us down below 18k within weeks
see last post

CME Reportables for BitcoinThe CME report for the 23rd to 30th of August came out Friday and saw interesting price action from Bitcoin.
Another approximate 1k range is currently between 20.4k and 19.3k.
This is similar to the previous range of 21.8k to 20.8k.
As of the report, Exchanges (Dealers/Intermediaries) increased their Longs by a massive 293%.
The change in Shorts being negligible could indicate an interest in holding the current lows.
Asset Managers / Institutionals are still closing their long positions and adding shorts however
given that the majority of their Long positions were created in November, December, and again in March
they are currently very out of position and this seems to be an act to hedge themselves and mitigate risk.
This can be seen as they have closed 1306 positions or 18% of their Longs since August 16th.
2 CME Gaps in Price Action still exist from November and December of 2020 at 17k and 18k.
With the majority of low leverage liquidity from July and August under the current low at 19.3k
a breakdown in price would occur swiftly to test lows from the beginning of July.
Until this range is confirmed broken, then the Support at 19.3k and 20.4k is still valid.
A word of caution; Be very careful Shorting into Support or Longing into Resistance.
Wait for confirmation of range break and assume it is a fakeout until it is confirmed as a breakout.

BTC OscillatorFreakin' hilarious, BTC has been the best indicator of market top and bottom this week.
Flipped puts yesterday at support and bought GM calls, flipped my calls on open and bought BITO puts at the resistance.
I have no idea if it breaks support or cycles back up next week, but holding those BITO puts for kicks and giggles. I plan to flip my puts Tuesday if it doesn;t break support over the weekend, at this point I figure the worst that can happen is that I lose today's profits. I don't see BTC breaking through resistance over the weekend though I suppose anything is possible.

Bitcoin CME FuturesBitcoin is struggling to exit two Trading Ranges.
The first Trading range is 19500 - 20600, and the larger one is 18525 - 25270.
In case we keep the 18000 zone support and break over 20600 and then 25270, the circled Gaps on CME Chart are expected to fulfill.
On the other side of the coin, if we lose the 18000 support, the main support is around 16250 and it's expected to work.
Let's see what happens!

BTC with NQ overlayLast couple of days I used BTC as an indicator to buy or sell as it hit support and resistance. This NQ overlay on top of BTC makes me wonder if it is now tracking the market, with a tendency to overshoot the selloffs.
Still trying to figure out BTC, I made money because of it this week, so I'll keep an eye on it. I have to anyways because I left open some BITO puts, lol.

BTC/TLTI mentioned this before, BTC price level depends on bond yields. The correlation doesn't hold day to day but the overall picture is still valid. Garbage stocks are the same way, I did an ARKK overlay a while back as well.
BTC holding this support area near 20k will depend entirely on if yields rise or not. I don't see yields dropping again so BTC has very limited upside potential right now. At the same time it's not worth shorting here.
I will short any pops though because there's zero reason for crypto to rally until the Fed starts cutting rates, and they've already said they won't NEXT YEAR. So expect another 15 months of crypto "winter". You would've made more money buying call options on anything else today.

the BTC is going up28000 is the perfect point to bay the bitcoin, if it's not broken 19000 zone, awere tp is 24555

Resistance in thr cloudBitcoin needs to break through the resistance it seems to be following. There’s a chance it could go sideways until October 10th while some accumulation happens . September up and downs between 19500 and 20300 are likely
It MUST have strength to smash through or it’s more downtrend

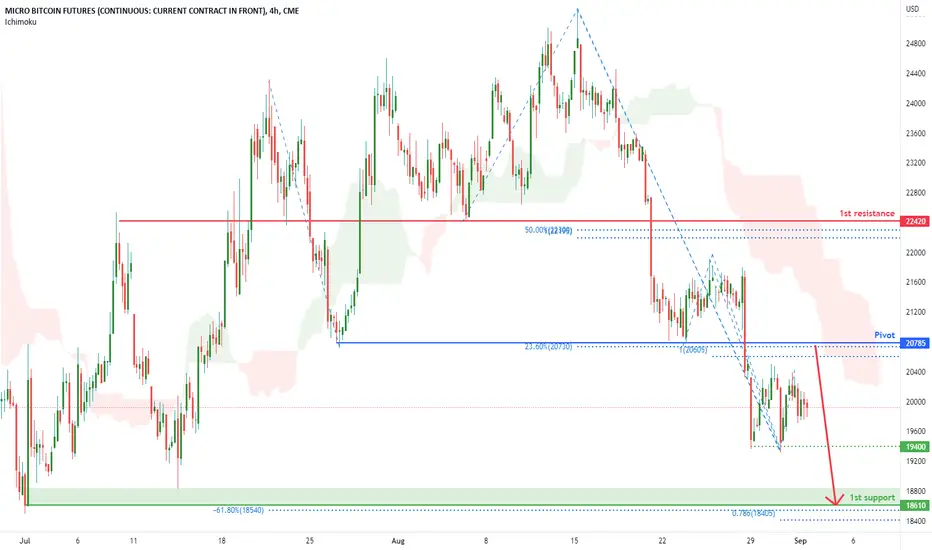
MICRO BITCOIN FUTURES (MBT1!), H4 Potential for Bearish DropType : Bearish Drop
Resistance : 22420
Pivot: 20785
Intermediate Support: 19400
Support : 18610
Preferred Case: On the H4, with price moving below an ichimoku indicator, we have a bearish bias that price will drop from pivot at 20785 where the pullback resistance, 100% fibonacci projection and 23.6% fibonacci retracement are to the 1st support at 18610 where the swing low support, 78.6% fibonacci projection and -61.8% fibonacci expansion are. Take note of intermediate support at 19400 where the swing low support is.
Alternative scenario: Alternatively, price could break pivot structure and rise to 1st resistance at 22420 where the overlap resistance, 100% fibonacci projection and 50% fibonacci retracement are.
Fundamentals: After Fed Chair Powell reiterated that the Fed will tighten policy to bring down inflation , we have a bearish view on Bitcoin .
MICRO BITCOIN FUTURES (MBT1!), H4 Potential for Bearish DropType : Bearish Drop
Resistance : 22420
Pivot: 20695
Intermediate Support: 19390
Support : 18830
Preferred Case: On the H4, with price moving below an ichimoku indicator, we have a bearish bias that price will drop from pivot at 20695 where the pullback resistance and 23.6% fibonacci retracement are to the 1st support at 18830 where the swing low support and -61.8% fibonacci expansion are. Take note of intermediate support at 19390 where the 127.2% fibonacci extension and swing low support are.
Alternative scenario: Alternatively, price could break pivot structure and rise to 1st resistance at 22420 where the overlap resistance, 100% fibonacci projection and 50% fibonacci retracement are.
Fundamentals: After Fed Chair Powell reiterated that the Fed will tighten policy to bring down inflation , we have a bearish view on Bitcoin .

🤖 #SENTIMENT- 30.08 🤖TLDR
In essence everything is pointing towards short term bear movement for the next 2-4 days and then potentially bull rally
USDT DOMINANCE
Hitting key resistance, overbought a bearish divergence and descending trendline. Equally a break out here would be huge but it is looking quite bearish which means money flow into BTC and Alts
ALT CAP EXCL. BTC & ETH
Playing out the last of a Head and shoulders pattern with the possible bottom in the next few days then could result in a big rally from there driving Alts up
BTC
Finishing off the last of a descending wedge over the next few days then possibel breakout on the cards
BTC DOMINANCE
We will likely see a bounce at the bottom of this channel now as a result of BTC pumping - this may leave Alts a little stagnant but they will follow.

MICRO BITCOIN FUTURES (MBT1!), H4 Potential for Bearish DropType : Bearish Drop
Resistance : 22420
Pivot: 20695
Intermediate Support: 19390
Support : 18830
Preferred Case: On the H4, with price moving below an ichimoku indicator, we have a bearish bias that price will drop from pivot at 20695 where the pullback resistance and 23.6% fibonacci retracement are to the 1st support at 18830 where the swing low support and -61.8% fibonacci expansion are. Take note of intermediate support at 19390 where the 127.2% fibonacci extension and swing low support are.
Alternative scenario: Alternatively, price could break pivot structure and rise to 1st resistance at 22420 where the overlap resistance, 100% fibonacci projection and 50% fibonacci retracement are.
Fundamentals: After Fed Chair Powell reiterated that the Fed will tighten policy to bring down inflation, we have a bearish view on Bitcoin.

WE CANNOT IGNORE BITCOIN HOLES.SEEMS ARE THE DRIVING SIGNALSHello.
I do not call the GAPS.
I do call them HOLES.
Today increased from 3 to 4.
The question is:
Are we going to cover the upper HOLES before to crash further?
The possibilities are 70% - 30% for upper movement first, simply because we just bottomed on the wave C.
If we accept that we follow a long term correction with ABCDE waves, bitcoin soon must start the wave D upside.
Thank you for reading my personal opinion.
Leave your comments below and click like if you agree with my idea.
I will really appreciate it and I wish you good luck with your personal choices.

Bitcoin Fib Simulation Mid-termfibs are set to default mode:
a - a.236 - a.382 - a.618 - a.786 - b - ...
Previous mode:
a - a.272 - a.414 - a.618 - b
Current default mode has more units to cover group of patterns which contributes to higher visualization of logical consequence of fluctuations and interconnectedness of market volatility to the nature of fibonacci phenomenon.
Any impulsive wave will be reflected at psychological levels of market which are in quantum state at Fibonacci intersections. Golden ratio always balances market out.
Tilt from idea below based on 2 ATH chart can be recreated and derived from just one recent cycle covered with 3 directions of FC projecting the multi-target system out of critical points of fractal.
For every action, there is an equal and opposite reaction.

Bullish look on btcHeld an important 618 during an absolutely horrific move on the nasdaq. stoch upcurved.
Had a whole short idea based on the fact that the Nasdaq hadn't moved down much, and that when it did move down BTC would fall of a cliff. This isn't the case.
While I'm not a mid term bull, getting short here is incredibly stupid.

