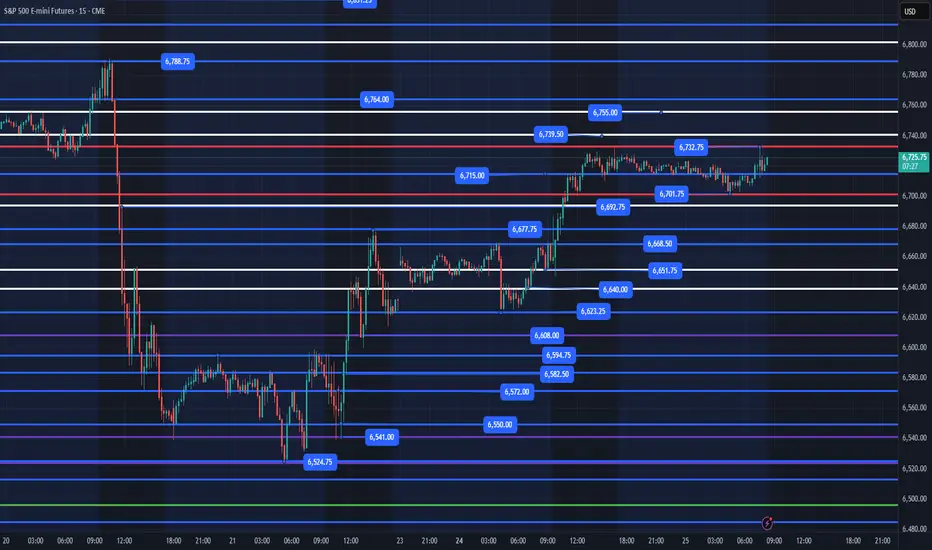
ES1 - Tame Black Friday or Dump IncomingUS Black Friday is known as quite a tame day with shorter hours...
But its worth noting that S&P Futures has reached the retracement Golden Window - an area where corrective action often peaks.
And its slightly above a significant resistance - in the higher liquidity zone.
So this is setting up for a potential Head & Shoulders Pattern.
When I refer to an H&S I do not at all consider that we can use it to judge downside - that theory is a nonsense in my opinion.
But it is a pattern that may lead to a pull back.
For now there is no price action to suggest a slump, but lets watch out for it because this is an ideal area for one if this move up proves to be exhausted.
If it does slump then high octane positions may be affected and there may be dips buys, but very deep buys may have relative buoyancy and hold.
This is a neutral post for now - we'll see how it develops 🧐.
This analysis is shared for educational purposes only and does not constitute financial advice. Please conduct your own research before making any trading decisions.
S&P 500 E-mini Futures
No trades
Market insights

ES Gap AlertIndex futures all threw a gap up on the Thanksgiving break. If it doesn't fill Friday, it'll probably fill Monday.
Don't recommend going long on the half day trading.

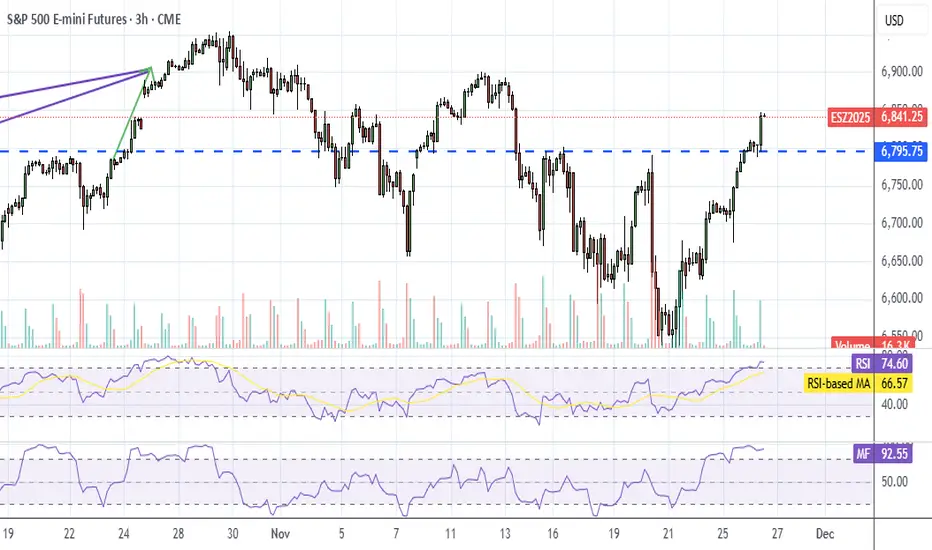
ES UpdateMFI and RSI hit overbought, so we might see a dip.
I'm guessing double top though, so no puts for now. Only carrying some long dated GLD calls.
Though about shorting GM, but decided not to. It's done well for me on the long side with calls.

what is gonna happend. need 30K till mid december... I believe the price will continue going up because of the momentum and the rate cut tomorrow… But you know how market works rarely in your favor. Is this gonna be another sell the news event if anybody got a clue, please help me out… Need to buy the house otherwise it's going on the auction.

Holding its ownIn the shortened trading session the daily chart for the S&P 500 indicates a market that's holding its own with very little volatility in creating the expectation of a sideways move on Friday.


Bullish ScenarioBroke out of downtrend ✔️
Pullback to yellow line is expected ✔️
Hold above yellow line = bullish ✔️
Next targets are 6,953 → 7,026 → 7,070+ ✔️

Bearish Scenario – ES Futures (BurakTheScalper)The chart shows a clear 3-tap rejection off the descending upper channel (orange arrows). Each touch has produced a lower high, confirming seller control at the channel top.
Price has now completed another full ABC corrective leg and is repeating the pattern of:
Lower High → Sharp Selloff → Channel Bottom Test
We are currently at the third rejection, which historically has been the strongest in a descending channel because:
✔️ Sellers defend the trendline aggressively
✔️ Liquidity builds above the 3rd touch → fuel for downside
✔️ Momentum typically shifts down sharply after the 3rd tap
If the pattern continues, ES is lined up for a full bearish leg toward the lower boundary of the channel.

ES1! - S&P E-mini Futures - Daily
Descending Broadening wedge variant. Prior session resistance at structural midpoint, now inside. A 3 higher high pullback trade setup.
Bias 1.580/1 buyers.
Happy Thanksgiving Everyone!

Momentum to the upside continuesMomentum to the upside continues in the S&P 500. The next objective to the upside is 6870.

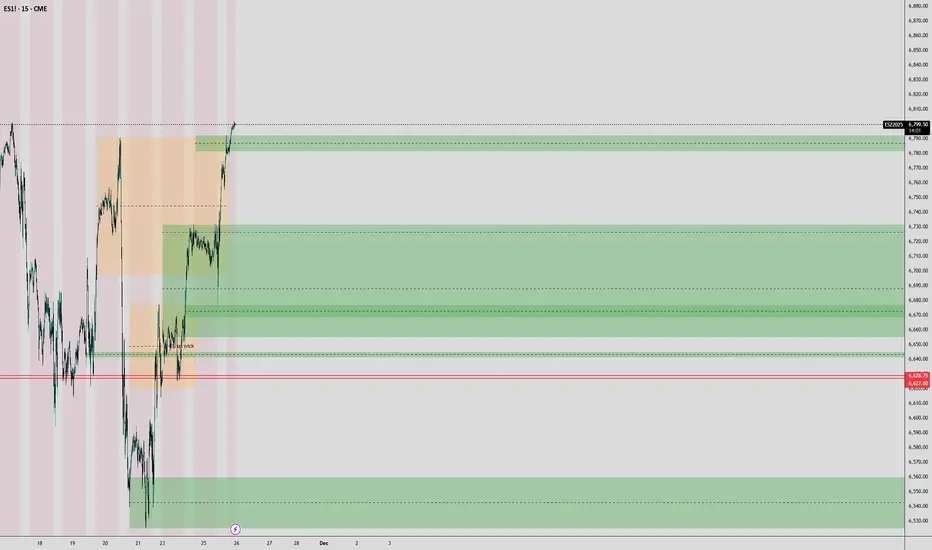
S&P Futures Trading Day 76 — Trading Away From the Keyboard GoneEnded the day -$921 trading S&P Futures. This was a tough one to swallow. I was busy running around and away from the screens, so I set limit orders at major levels I was confident would reject. Unfortunately, the market had other plans—a surprise short squeeze triggered by the Ukraine peace deal news broke through everything. In hindsight, I should have sized down to 5 MES instead of 10 given I wasn't watching the charts, but truthfully, this felt like one of those unavoidable losses where a macro shock simply invalidates the technicals.
🔔News Highlights: *UKRAINE AGREES TO PEACE DEAL WITH US, TALKS WITH RUSSIA UNDERWAY
📈 Key Levels for Tomorrow:
Above 6790= Bullish Level
Below 6740= Bearish Level

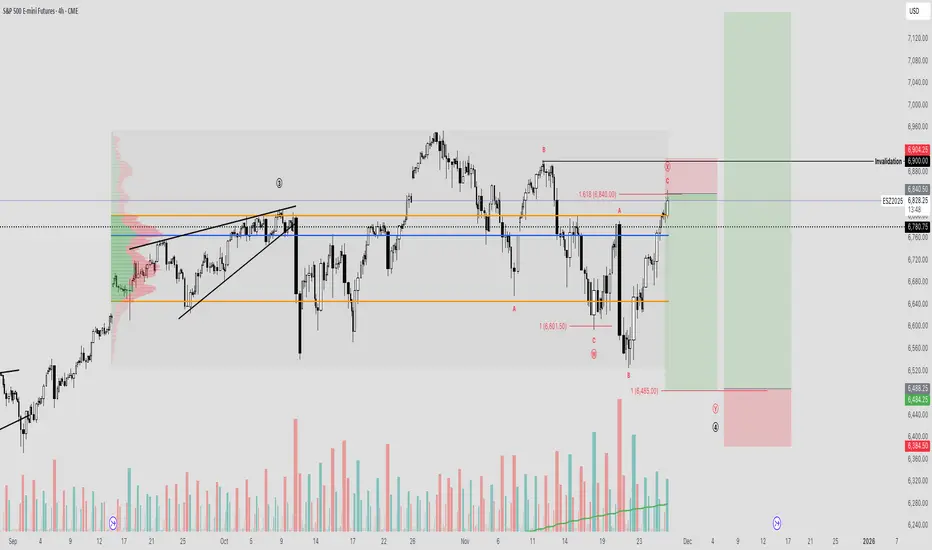
SPY: The Final Capitulation Before the Blow OffThe S&P 500 has experienced notably choppy price action over the past 60 days following the Federal Reserve’s rate cut. Many large-cap stocks most notably Nvidia, which saw a substantial rally have provided attractive profit-taking opportunities. Since then, the broader market has been trading sideways and, more specifically, within a local downtrend over the last 30 days.
From an Elliott Wave perspective, this pullback may be unfolding as a complex WXY corrective structure. A WXY pattern is essentially a series of connected ABC corrections each consisting of a three-wave “measured moves" that collectively form a more drawn-out and often more intricate consolidation phase. These moves can be mathematically projected using fibonacci.
The purpose of such a correction is typically to cool off the market after an extended rally. This cooling phase can manifest as a meaningful price decline, a time-based consolidation, or a combination of both. Ultimately, it allows market sentiment to reset and establishes a balanced range from which a stronger, more sustainable breakout can occur.
The main point of uncertainty lies in whether the W wave has been correctly identified. The subsequent X wave appears to form an expanding flat structure composed of three waves, ending with an impulsive move that taps the 1.618 extension—aligning well with typical Fibonacci market mathematics.
If a final Y-wave leg lower is still ahead, we have a clearly defined 1% invalidation level. Below that, a deeper sweep of the previous low becomes possible, allowing us to draw a trend-based Fibonacci extension from the W and X pivots to project a potential termination point for wave Y.
I’ll be closely monitoring this lower region, as it could present an excellent buying opportunity—one that could position the market for significantly higher upside targets and, at minimum, a retest or sweep of the current all-time highs.
ES UpdateRSI and MFI overbought but it looks like a melt up and probably a double top, possibly a new high since MSFT appears to be rallying back now.
Much like this summer, I decided to play gold instead of chasing an overbought stock market. Stocks usually don't do much on Thanksgiving Friday anyways.
Exchange Rates Guide1. Introduction to Exchange Rates
An exchange rate is the price of one currency expressed in terms of another. For example, if 1 US Dollar (USD) equals 83 Indian Rupees (INR), the exchange rate is 1 USD = 83 INR. Exchange rates serve as a mechanism to facilitate international trade and investment, allowing buyers and sellers to transact across borders.
Exchange rates can be quoted in two ways:
Direct quotation: Domestic currency per unit of foreign currency (e.g., INR per USD).
Indirect quotation: Foreign currency per unit of domestic currency (e.g., USD per INR).
2. Types of Exchange Rates
Exchange rates can broadly be classified into two main categories:
a. Fixed Exchange Rate
A fixed exchange rate, also known as a pegged rate, is set and maintained by a country’s central bank. The domestic currency is tied to a major currency such as the USD, EUR, or a basket of currencies. The central bank intervenes in the foreign exchange market to maintain the rate within a narrow band.
Advantages:
Stability in international trade.
Reduced exchange rate risk for businesses and investors.
Disadvantages:
Requires large foreign exchange reserves to defend the peg.
Less flexibility to respond to domestic economic conditions.
Examples:
Hong Kong maintains a peg to the USD.
Some Caribbean nations peg their currency to the USD.
b. Floating Exchange Rate
A floating exchange rate is determined by the forces of supply and demand in the foreign exchange market. There is no central bank intervention unless extreme volatility occurs.
Advantages:
Automatic adjustment to economic conditions.
No need for large foreign reserves to maintain the currency value.
Disadvantages:
Can be volatile and unpredictable.
May create uncertainty for international businesses.
Examples:
USD, EUR, and JPY operate largely under floating rates.
c. Managed or Hybrid Exchange Rate
Some countries use a managed float, where the currency primarily floats but the central bank occasionally intervenes to stabilize it. This approach provides a balance between stability and flexibility.
Example:
India uses a managed float system, allowing the INR to fluctuate but intervening when necessary.
3. Determinants of Exchange Rates
Exchange rates are influenced by multiple economic, political, and market factors:
a. Interest Rates
Higher interest rates in a country tend to attract foreign capital, increasing demand for that currency and causing appreciation. Conversely, lower rates may lead to depreciation.
b. Inflation Rates
Countries with lower inflation typically see their currency appreciate, as purchasing power remains strong relative to high-inflation countries.
c. Economic Growth
Strong economic performance attracts foreign investment, boosting demand for the domestic currency. Weak growth may lead to depreciation.
d. Political Stability
Countries with stable political systems attract more investment, supporting currency strength. Political turmoil or uncertainty can weaken a currency.
e. Trade Balance
A country with a trade surplus (exports > imports) experiences higher demand for its currency, leading to appreciation. A trade deficit can cause depreciation.
f. Speculation
Traders in the forex market often buy or sell currencies based on expected future movements, influencing exchange rates.
g. Central Bank Intervention
Central banks may buy or sell currencies to control volatility or maintain competitiveness in international trade.
4. How Exchange Rates Are Quoted
Currencies are always quoted in pairs, e.g., USD/INR or EUR/USD. The first currency is called the base currency, and the second is the quote currency.
Example: USD/INR = 83 means 1 USD equals 83 INR.
Bid price: The rate at which the market is willing to buy the base currency.
Ask price: The rate at which the market is willing to sell the base currency.
The difference between the bid and ask price is known as the spread, which represents transaction costs.
5. Impact of Exchange Rates
Exchange rates affect individuals, businesses, and entire economies:
a. International Trade
A weaker domestic currency makes exports cheaper and imports more expensive, potentially improving trade balances. A stronger currency has the opposite effect.
b. Investments
Investors consider exchange rates when investing abroad. Currency fluctuations can affect returns on foreign assets.
c. Inflation and Interest Rates
Depreciation can lead to higher import costs, causing inflation. Central banks may adjust interest rates to stabilize currency value.
d. Tourism
Tourists benefit from strong domestic currencies when traveling abroad, as they get more foreign currency for the same amount.
e. Government Debt
Countries with debt denominated in foreign currency may face higher repayment costs if their currency depreciates.
6. Foreign Exchange Market (Forex)
The foreign exchange market is the global decentralized market where currencies are traded. It operates 24/7 and is the largest financial market in the world, with daily trading volumes exceeding $8 trillion.
Key participants:
Central banks
Commercial banks
Hedge funds and investment managers
Corporations
Retail traders
Major currency pairs:
EUR/USD (Euro/US Dollar)
USD/JPY (US Dollar/Japanese Yen)
GBP/USD (British Pound/US Dollar)
USD/INR (US Dollar/Indian Rupee)
7. Exchange Rate Regimes Across Countries
Different countries adopt different regimes based on economic goals:
Developed economies: Typically floating rates.
Emerging markets: Often managed floats to control volatility.
Small economies: Frequently peg to a major currency for stability.
8. Currency Conversion and Hedging
Businesses dealing in multiple currencies often use hedging strategies to mitigate exchange rate risk. Common tools include:
Forward contracts: Lock in a future exchange rate.
Options: Provide the right, but not obligation, to exchange at a predetermined rate.
Swaps: Exchange currencies over a specified period.
Hedging helps reduce uncertainty, especially for exporters and importers.
9. Exchange Rate Policies
Countries implement policies to stabilize their currencies and protect the economy:
Monetary policy: Adjusting interest rates and liquidity.
Foreign exchange reserves: Buying or selling currencies to influence rates.
Capital controls: Regulating capital flows to reduce volatility.
10. Conclusion
Exchange rates play a pivotal role in the global economy, affecting trade, investment, inflation, and overall financial stability. Understanding how they are determined, the factors influencing them, and their impact on various sectors is essential for investors, businesses, and policymakers. Whether a currency is fixed, floating, or managed, the goal is to balance economic stability with competitiveness in the international arena.
A solid grasp of exchange rates and their mechanisms empowers individuals and organizations to make informed financial decisions, hedge against risks, and navigate the complex world of global finance.
here is the clean price action i am short on this till yesterday mid day !! trade setup is up !! everything is alligned now just go for the short
ES (SPX, SPY) Analysis, Levels, Setups for Wed (Nov 26)Market Overview
The equity markets are currently facing a pivotal moment. The E-mini S&P 500 (ES) has made a significant rebound from the daily low around 6,520, approaching robust resistance levels formed by the highs of the previous week and yesterday. Both daily and 4-hour charts reveal a consistent pattern of higher lows emerging from a recent trough. However, the price now finds itself just beneath a key distribution cap and Fibonacci extension zone, estimated between 6,810 and 6,888. The daily momentum oscillator has shifted upward from an oversold position and remains at a mid-range level, indicating that while it is not yet overbought, the general trend still favors buying the dips, provided that crucial support levels are maintained.
Meanwhile, the Nasdaq 100 (NQ) mirrors this momentum, hovering near its New York Pre-Market (NYPM) peak. Recent gains have been bolstered by impressive earnings from Nvidia, highlighting the ongoing AI narrative, even as concerns about a potential market bubble begin to emerge, with NVDA's stock showing signs of volatility.
Events & News for Wednesday 26 Nov (Pre-Thanksgiving)
Wednesday is a data-heavy session in the U.S., and it’s also the last “normal” day before the Thanksgiving holiday liquidity vacuum. Expect volatility spikes and potential regime shifts around:
• 08:30 ET – Weekly jobless claims plus a cluster of delayed October releases: durable goods orders, trade balance/wholesale data, personal income & core PCE inflation, and related indicators.
• 10:00 ET – New home sales and other housing-related data.
• 10:30 ET – EIA crude oil inventories (can move risk sentiment via energy/curve).
• 14:00 ET – Fed Beige Book, giving an updated regional read on growth and inflation ahead of December’s FOMC meeting.
In addition, the BEA has postponed the Q3 GDP second estimate that had been scheduled for this week, so markets are leaning more heavily on the data above for macro guidance.
Net takeaway: 8:30 ET is the main volatility window, with a second impulse risk at 10:00–10:30 and potential trend extension or reversal into the NY morning kill-zone.
Key Zones (ES Z-25, based on current structure)
Immediate Resistance
• R1: 6,790–6,795
NYPM High / Prior Day High cluster (NYPM.H 6,792.5, PDH & Y-VAH 6,792.5). Sellers have defended this intraday band so far; it’s the lid of today’s range.
• R2: 6,805–6,815
1H fib extension 1.272 (≈ 6,810.25) plus likely PWH vicinity. First HTF extension above today’s range; a clean “stop run & decision zone” if 6,795 breaks.
• R3: 6,840–6,850
1H fib extension 1.618 (≈ 6,847.25). If buyers punch through R2, this is the next logical magnet and a strong candidate for an exhaustion spike on good data.
• R4: 6,880–6,900
1H fib 2.000 (≈ 6,888) and prior daily swing-high area. That whole 6,888–6,900 pocket is a big-picture objective and, for now, a likely “weak high” that could attract a stop run but also host the first serious counter-trend attempts.
Support / Demand
• S1: 6,765–6,775
Yesterday’s POC (~6,769.5), NY lunch high/NYL.H (6,774.25), and top of the 1H consolidation shelf. As long as the market keeps closing above this band on 15–60m, the short-term uptrend remains intact.
• S2: 6,720–6,735
Y-VAL 6,720.5, LO.H 6,721.5, ONH 6,732.5. This is the top of the prior value area and a natural “buy-the-dip” location if 6,770 gives way on data noise.
• S3: 6,670–6,705
NYAM.L 6,674.5, IB Low 6,674.5, ONL 6,701.75, plus current LOL 6,701.75. If we get a deeper flush, this is the primary intraday demand band where bulls must step back in to preserve the recent trend from the daily low.
• S4: 6,560–6,580
PDL 6,574.5 and top of the larger daily discount block. A break and sustained acceptance below here would open the door for a much larger retrace back toward the 6,520–6,420 HTF discount zone (daily 1.272/1.618 fibs).
Market Outlook: Bias & Forecast (Overnight → NY Session)
Structural Bias:
The prevailing market sentiment remains bullish as long as the E-mini S&P 500 (ES) sustains its position above the support range of 6,720–6,735 on a closing basis. The likely trajectory indicates a probing towards the 6,810–6,850 extension band. While the recent rally shows signs of being extended, it has not yet reached a point of definitive exhaustion, pointing towards a “late-stage impulse” rather than a confirmed top.
Overnight → London Session:
The base case anticipates a sideways-to-moderately downward movement from the 6,790s back toward the support levels of S1/S2 (6,765 → 6,730). This move aims to address intraday imbalances without disturbing the overall market structure. Should liquidity be limited, there may be an attempt during the London session to trigger stops through today's highs, directing attention towards resistance levels R2 (6,805–6,815) ahead of the New York session's developments.
New York AM Session (8:30–11:00 ET):
Should robust data emerge—indicating a favorable economic climate with subdued core Personal Consumption Expenditures (PCE) and steady labor claims—this is likely to spark a rally through R1 towards R2/R3, targeting 6,810 and subsequently 6,847 as key upside magnets. Conversely, a negative surprise featuring weak growth, a troubling inflation mix, or a risk-off sentiment evident in the Beige Book later in the day could dramatically alter the market landscape, potentially driving a liquidation toward support levels S2/S3, or in case of an unexpected shock, even probing S4 over the coming 24 to 48 hours.
In the near term, the expectation leans towards a gradual upward movement with shallow pullbacks, aiming for the 6,810–6,847 range. However, traders should remain vigilant for an increased risk of an exhaustion spike and a possible intraday reversal as this target zone is approached.
A++ Setups for Tomorrow
A++ Setup 1 – Trend Long from Retest of 6,730–6,770
Trigger:
Price trades down into 6,730–6,770 (S1/S2 overlap) either overnight or on the 8:30 data flush.
15m prints a higher low and closes back above ~6,755, reclaiming the mid-range.
5m confirms with a clear reclaim and hold of 6,760–6,770, then a higher low on 1m.
Entry Zone: 6,760–6,775 on a clean pullback after reclaim (not the first knife-catch wick).
Initial Stop: Below 6,720, tucked beyond Y-VAL/LO.H and the pullback low (≈ 35–45 pts risk depending on your exact fill).
Targets:
• TP1: 6,810–6,815 (R2 / 1.272 fib).
• TP2: 6,840–6,850 (R3 / 1.618 fib).
• Stretch: 6,880–6,900 (R4 / 2.0 fib) if data and risk sentiment stay supportive.
A++ Setup 2 – Exhaustion Short from 6,847–6,888
Trigger:
Impulsive move into 6,847–6,888 during NY AM or early PM, ideally on or shortly after 8:30 data.
15m candle shows rejection (long upper wick) and closes back below ~6,847.
5m prints a lower high under that rejection high, and 1m fails to make new highs on retests.
Entry Zone: 6,845–6,865 on the first proper lower-high after the rejection (avoid shorting the exact wick; let the LH print).
Initial Stop: Above 6,900, beyond the 2.0 fib and psychological round number (≈ 35–45 pts risk).
Targets:
• TP1: 6,790–6,795 (R1 / NYPMH/PDH cluster).
• TP2: 6,760–6,770 (S1 pivot band).
• Stretch: 6,720–6,735 (S2 / top of value) if selling pressure persists.

A step in the right directionBuyers continue to support the daily chart of the S&P 500 going into Wednesday session. The next objective to the upside is 6820.

ES UpdateMFI is overbought, RSI is about to get there, but I think all we will get is a dip and not a tank because FDAX regained support.
I'm assuming a slow melt up at this point, I don't play melt ups with options, so unless there's a big drop, don't expect updates.
The blue resistance line represents where the market was before Trump's tariff announcement, so at this point we're right back to where we were, lol. Also, all of the gaps filled, so I don't have an upward or downward target.

Bullish Hidden Divergence Signals Rally Toward 6,950 ResistanceThe S&P 500 E-mini is showing a bullish hidden divergence on the MACD indicator, suggesting strong underlying momentum despite recent pullbacks. Price has bounced from key support near 6,538 and is targeting the major resistance level at 6,953. Watch for confirmation of this move as it could mark the continuation of the uptrend and a potential breakout to new highs.

ES - November 25th - Daily Trade PlanNovember 25th- Daily Trade Plan - 8:25am
*Before reading this trade plan, if you did not read yesterday's take the time to read it first! (You can view the posts in the related publication section) *
If my posts provide quality information that has helped you with your trading journey. Feel free to boost it for others to find and learn, also!
My daily trade plan and real-time notes that I post are intended for myself to easily be able to go back and review my plan and how I did from an execution perspective.
--------------------------------------------------------------------------------------------------------
As many of you know that when we have a big sell off like we did last week, we squeeze higher and usually will back test the area we broke down from. When this happens, we will have 2-3 days where price will not flush the previous day's low and you have to find opportunities in other levels to grab some points.
When we are in a tight range, we can usually find a flush and reclaim of the 9:30-9:45am low can be another good place to look to enter. This could be something like flush below 6715 to 6706-11 and then reclaim the session opening low. (This is not how I typically look for points, but it is a good way when we are in a tight range and have limited setups.)
The overnight high is 6732 and Overnight low is 6701.
Key Levels Today
1. 6732 reclaim (Back test of this level should give us a move to 6755)
2. 6701 flush and reclaim
3. 6669 - flush and reclaim
4. 6623 - flush and reclaim
Below there and I would be patient and wait to see what price does at the levels below.
I will post an update around 10am EST
----------------------------------------------------------------------------------------------------------------
Couple of things about how I color code my levels.
1. Purple shows the weekly Low
2. Red shows the current overnight session High/Low (time of post)
3. Blue shows the previous day's session Low (also other previous day's lows)
5. White Levels are previous day's session High/Low
Uptrend Started After Liberation Day - All Has Broken BelowThe US markets have been described as “on a rally” for quite some time. I would not agree if it is meant to describe the overall US market, but would agree if it refers specifically to AI or tech stocks. Why?
Among the four major US indices, the Russell—representing a much broader base of US-listed companies—continues to struggle to break above its high from last year, even though the others have far surpassed it. In fact, it has since corrected by 9.5% since its all-time high just last month.
After that, the other indices are also following suit only in the past few days, breaking below this uptrend that started in April.
Russell has taken the lead and has broken below this trend in late October.
The earliest clue came from the Russell Index, where many suppliers of the Magnificent 7 companies are also part of Russell 2000 components. When the Russell—or smaller-cap companies—starts to weaken, it often reflects broader market pressures that may eventually spill over to the rest of the indices or vice versa.
Video version on the process of how I monitor the four indices and then narrow it down to the individual index.
Micro E-mini Russell 2000 Index
Ticker: M2K
Minimum fluctuation:
0.10 index points = $0.50
Disclaimer:
• What presented here is not a recommendation, please consult your licensed broker.
• Our mission is to create lateral thinking skills for every investor and trader, knowing when to take a calculated risk with market uncertainty and a bolder risk when opportunity arises.
CME Real-time Market Data help identify trading set-ups in real-time and express my market views. If you have futures in your trading portfolio, you can check out on CME Group data plans available that suit your trading needs www.tradingview.com

The Magnificent Seven - A Great Victory with High CasualtyCME: Micro E-Mini S&P 500 ( CME_MINI:MES1! )
The “Magnificent Seven” are the darlings in the U.S. stock market. The seven High-Tech stocks, including Nvidia NASDAQ:NVDA , Apple NASDAQ:AAPL , Tesla NASDAQ:TSLA , Microsoft NASDAQ:MSFT , Google NASDAQ:GOOGL , Meta NASDAQ:META and Amazon NASDAQ:AMZN , are up roughly 21% year-to-date as a group. Together they represent 34-37% of the market capitalization of the entire S&P 500 index.
Meanwhile, the remaining 493 companies in the S&P 500 returned just 12% YTD. Altogether, the S&P 500 index has a YTD return of 13.5% as of November 24th.
During the stock market bull run driven by A.I., a high concentration of the “Mag 7” could generate better returns. An investor could buy the MAGS Magnificent Seven ETF, which invests 100% in the “Mag 7” only. MAGS has a YTD return of 21.0%. A more aggressive investor could play his bet in Direxion Daily Magnificent 7 Bull 2X Shares ETF. This fund aims to replicate twice the return of the “Mag 7” and yield 29.0% YTD.
Minding the Risk of Mag 7 Casualty
The nickname “Magnificent Seven” came from the 1960 American Western. In the plot, a gang of bandits periodically raids a poor Mexican village for food and supplies. The farmers turn to gunslinger Chris Adams for help. Chris assembles a group of seven warriors to fight the gang. They eventually defeat the bandits and save the village.
The Magnificent Seven is my favorite Western movie. The gun fight led by Yul Brynner and Steve McQueen is legendary. And the Oscar-winning theme song is still playing in many grand ceremonies these days.
The analyst who coined the term for the stocks may also be a big fan of the movie. However, he only saw the great victory but overlooked its heavy toll. Four out of the seven warriors perished in the final fight.
A question for today: Could all seven stocks be winners to the end?
In past technological breakthroughs, many big players did not survive, even if they were market leaders at some point and technology did prevail eventually:
• In the Railway boom of the mid-1900s, thousands of railroad companies were formed. At least 300 were listed in the New York Stock Exchange. And 99% of them went bankrupt once the industry consolidated.
• In the automobile boom of the early 1920s, over 600 car makers were founded, and only 30 of them were still operational by the 1930s. And the eventual victors were the Big Three in Detroit.
• In the Internet boom of the 1990s, thousands of startups popped up. And 80% went bankrupt when the dotcom bubble burst in 2000.
• Since Tesla was founded in 2003, over 100 electric vehicle companies were founded. Dozens already folded after burning through cash and not generating sales.
We are seeing the same pattern repeating in renewable energy (solar and wind), computer chips, and now in A.I. startups too. Taken from historical lessons, investing in individual stocks in any transformational new technology sector is highly risky. The leading man could be sidelined as soon as a newer version of the technology comes through.
I have no doubt that A.I. is our future. I just don’t know which of the Mag 7 will survive to the end to collect their $20 payout from the Mexican farmers.
Investing in Micro E-Mini S&P 500 Futures
If an investor is bullish on A.I. but mindful of the single-stock risk exposure, he could explore the CME Micro E-Mini S&P 500 Futures.
The MES contracts offer smaller-sized versions of CME Group’s benchmark S&P 500 futures (ES) contracts. Micro futures have a contract size of $5 times the S&P 500 index, which is 1/10th of the E-Mini contract.
Micro contracts are very liquid. CME Group data shows that 2,349,680 contracts were traded last Friday, November 21st. Open Interest at the end of the day was 298,556.
Buying or selling 1 MES contract requires an initial margin of $2,262. With Monday closing price of 6,677.75, each March 2026 contract (MESH6) has a notional value of $33,388.75 (= 6677.75 x 5). Compared with investing in stocks, the futures contracts offer a built-in leverage of about 14.8 times (=33388.75/2262).
Hypothetically, if S&P futures price rises 10% to 7,012, the price gain of 668 points will translate into $3,340 (= 668*5) in profit for a long position, given each index point equal to $5 for the Micro contract. Using the initial margin of $2,262 as a cost base, the trade would produce a theoretical return of 147% (=3340/2262).
The risk to long Micro S&P is that the US stock market correction continues to deepen. To limit the downside risk, a trader could set up a stop-loss when entering a long position.
For illustration, a trade executed a long trade at 6,680 could be combined with a 6,300 stop. If the S&P falls to 6,000, the trader’s position will be liquidated well before that. The maximum loss would be $1,900 (= (6680-6300) * $5).
Happy trading.
Disclaimers
*Trade ideas cited above are for illustration only, as an integral part of a case study to demonstrate the fundamental concepts in risk management under the market scenarios being discussed. They shall not be construed as investment recommendations or advice. Nor are they used to promote any specific products, or services.
CME Real-time Market Data help identify trading set-ups and express my market views. If you have futures in your trading portfolio, you can check out on CME Group data plans available that suit your trading needs www.tradingview.com
