Edge of a Revolution SP Ending diagonalSpeaks for itself.
Good luck!
Nickel and a dime: www.youtube.com
MESM2022 trade ideas

ES Big fib level approaching78.6 fib approaching. Will be interesting to see the reaction into the next few days / end of this year. Caution

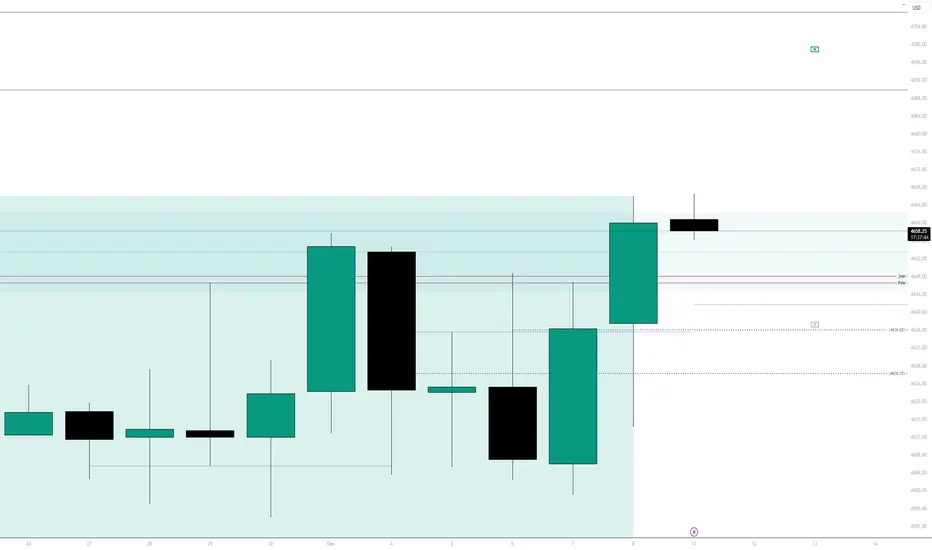
We got to that blue shaded V.I like I outlinedToday's news Dec.12 which included CPI gave us the run up into the buyside liquidity that I was looking for... Going into tomorrow Dec.13 we have PPI and FOMC AT 2:30PM EST.... looking for price to run up into 4685.25 around that time.

ES1! Key Levels into EOY 2023ES1! 6WK: Update from April 14, 2023 Publish:
0.786 Levels clear development of structure into EOY.
KL: 4741.25
Risk on sentiment as evidenced by confluence of sigma 1 and 0.5 fibonacci level (4155.25) now approached 0.236 fibonacci level (4500). This was a high area of interest as PA reverted to mean because it was where price acceptance has occurred (Oct 2020) and where price acceptance was rejected (Feb 2020)//
Regression analysis with pearsons r of .9558//
VIX 12.04
Price at time of study 4693.75//
KL: 4741.25
Upcoming macro events and earnings guidance will be factored in alongside breadth and yield measures// Bias: Risk On

Buy mini SP at 4554 limit, stop at 4496, tgt openBuy mini SP at 4554 limit, stop at 4496, tgt open
Risk Disclosure

12/12 Trading Plan - Monday Recap and Day Ahead📊 Market Sentiment: Neutral to Bullish
📈 The Markets Overnight
🌏 Asia: Up
🌍 Europe: Up slightly
🌎 US Index Futures: Very near unchanged after declining
🛢 Crude Oil: Down a lot
💵 Dollar: Down slightly
🧐 Yields: Down slightly but well off the lows
🔮 Crypto: Up
🌏 Major Global Catalysts
CPI inflation prints very slightly hotter m/m, inline with expectations.
COP28 hits roadblock over fossil fuels phaseout language.
📷 Snapshot
Daily Data Sentiment Analysis:
EMA 9, 21, 55: Indicating a bullish sentiment with closing prices comfortably above these EMAs.
Overall Sentiment: Bullish.
4-Hour Data Sentiment Analysis:
EMA 9, 21, 55: Also showing a bullish trend.
Overall Sentiment: Bullish.
🔍 Key Resistance Levels:
4755: Long-term target
4685-4697: (current)
🔍 Key Support Levels:
4630-4635: (current)
4573 & 4580: Significant resistance-turned-support zone.
4556-4558: Indicating a choppy trading range.
4540-4542: Acting as support post-breakout.
4514 & 4497: Important back-testing zones.
4450: Immediate backtest point previous post-CPI announcement.
📉 Support Levels
Major: 4668, 4635-4630, 4593-4596, 4565-4560
Minor: 4661, 4655, 4647, 4642, 4617-4620, 4606, 4585, 4576, 4547, 4534, 4524, 4511-4513, 4504, 4485, 4475, 4466, 4458, 4449, 4433, 4426, 4410-4415, 4405, 4392, 4386, 4377, 4366, 4353, 4342, 4331, 4320, 4310
📈 Resistance Levels
Major: 4685-4697, 4710-4713, 4723, 4734, 4743, 4753-4756, 4768, 4775, 4788, 4794, 4805-4810, 4816, 4826, 4838, 4860, 4869, 4885
Minor: 4673, 4697, 4718, 4734, 4743, 4768, 4775, 4788, 4794, 4816, 4826
📝 Trading Plan
Bullish Scenario: Watch key support at 4668 and 4635-4630 for potential entry points on a reclaim.
Bearish Scenario: Resistance at 4685 could offer short opportunities if it fails to break, but with the trend being bullish, counter-trend trades are not preferred.
Disclosure: This is not financial advice and is for informational purposes only. Please consult a professional financial advisor before making any investment decision.

12/11 Trading Plan - Last Week Recap and Day Ahead📊 Market Sentiment: Bullish
Both the 4-hour and daily data indicate a bullish sentiment for the S&P 500 Index Futures, with closing prices consistently above the 9, 21, and 55 EMAs.
🔄 Market Recap
Last Thursday's rally from 4556 to 4590 occurred on a textbook failed breakdown. This was followed by another squeeze after the NFP release last Friday, due to yet another failed breakdown. The market exhibited a strong performance with closing prices maintaining above key EMA levels, indicating sustained bullish momentum. This trend was consistent across both the daily and 4-hour charts.
📈 The Markets Overnight
🌏 Asia: Mostly up, Japan down a lot
🌍 Europe: Up
🌎 US Index Futures: Mixed
🛢 Crude Oil: Up strongly
💵 Dollar: Up
🧐 Yields: Up strongly
🔮 Crypto: Up
🌏 Major Global Catalysts
Japanese stocks continue their steep decline fall, the Yen continues to rally as traders expect the Bank of Japan will exit it’s longtime negative rate policy this month.
📷 Snapshot
Daily Data Sentiment Analysis:
EMA 9, 21, 55: Indicating a bullish sentiment with closing prices comfortably above these EMAs.
Closest Support and Resistance: Support at 4580, resistance at 4632.
Overall Sentiment: Bullish.
4-Hour Data Sentiment Analysis:
EMA 9, 21, 55: Also showing a bullish trend.
Closest Support and Resistance: Support at 4580, resistance at 4642.
Overall Sentiment: Bullish.
🔍 Key Resistance Levels:
4755: Long-term target, significant in current market context.
4680-4685: Crucial for validating bullish trend strength.
4658: First major breakout zone.
4642-4645: Key current market zone.
4620-4625: Potential for breach due to significant basing.
🔍 Key Support Levels:
4573 & 4580: Significant resistance-turned-support zone.
4556-4558: Indicating a choppy trading range.
4540-4542: Acting as support post breakout.
4514 & 4497: Important back-testing zones.
4450: Immediate backtest point post-CPI announcement.
📉 Support Levels
Major: 4556, 4539-42, 4520, 4496, 4463, 4450, 4431, 4408, 4389
Minor: 4548, 4530, 4524, 4512, 4507, 4485, 4475, 4443, 4436, 4418, 4414, 4399
📈 Resistance Levels
Major: 4573, 4580, 4590-93, 4618-22, 4640-42, 4657, 4680-84, 4711, 4727, 4747, 4755
Minor: 4565, 4597, 4609, 4633, 4648, 4666, 4693, 4704, 4722, 4739-41
📝 Trading Plan
Bullish Scenario: Sustaining above key supports and breaching resistances, particularly at 4620-4625 and 4658, suggests a continuation of the bullish trend.
Bearish Scenario: A reversal below key supports, notably below 4556, could signify a shift to bearish sentiment.
💡 Wrap Up
In conclusion, last week was good for the market with a bullish trend. However, some hangover is likely today, and the market will most likely be waiting for CPI and FOMC releases to commit to further moves. As long as 4647-4540 holds on dips, the market can continue the path higher to 4660, 4667, and 4685 target. If 4640 fails, we test 4624, potentially leading to a sell-off.
Disclosure: This is not financial advice and is for informational purposes only. Please consult a professional financial advisor before making any investment decision.

SPY ANALYSIS 12/11This is the trade I have planned for today. After a break of the trendline, I can see some bearish action. I am expecting a rejection from the FVG for a nice r:r play. I will monitor the PCC at 9:45 for further confirmation.

ES - Bullish - 2nd Week of DecemberWe have SMT at daily lows with NQ. NQ trade into & away from it's daily bisi. ES did not trade into it's BISI at all. ES has maintained it's strength. I am anticipating Tuesday/Wednesday low of the Week & am aiming for the Daily Volume Imbalance.
I'm bullish looking for higher prices I want to see price draw UP into that blue shaded volume imbalance after consolidating for a bit I think price will loosen up due to the news events we have coming this week


The ideal is to have a double top!If we want to see the index rising like a rocket, I think it's better to have a double top as soon as possible. Preferably in 2023. Yes, that's right, we have to form a double top if we want to escape something worse.
Think about it with me: apparently the US is willing to control inflation, whatever the cost. Proof of this is seeing the FED not relaxing interest rates.
Another factor that we can mention is that the employment rate is at full steam, coming above market consensus with each new release, a clear sign of a strong economy. Maybe via (QE), but still, strong.
If we use these two miserable items as arguments, and see the FED keep its word to contain inflation (austerity via interest rates), we believe that we will have interest rates above 5% per year for a good period in 2024.
Based on these goals, I believe that by the beginning of the third quarter the boldness to control the infinite Quantitative Easing (QE) will really have its practical effects on the economy, thus allowing us to have the interest cuts expected from this period onwards.
In the last analysis I even mentioned that we may be experiencing the formation of a C&H, but I thought about it, I would rather experience a double top at 4808. Believe me, having a double top will be better. Lol.
Below I leave the image of the first bullish pivot formed after the post-pandemic (QE) Rally in November 2022. At the current moment it is reaching 100% of the FIB projection. It has the strength to reach the 4824 region, which according to the SETUP that I use is a region of resistance, and consequently, the double top region that I mention in this text. What a thing, right?
For this week things still need to be discharged. We have prices working within a high medium-term pivot. This could corroborate the thesis that we will have a double top in 2023, after all, the golden region of this medium-term pivot is at 4827. Maybe we will have a wick in the last weekly candle of 2023. Haha.
Below I leave a view of the short-term charts. We are so close to reaching the all-time high again. There is only a measly 3.6% increase left. Is it too much to ask for sardines and institutions to help this happen by doing some shopping at Famangs?
Do your analysis and good business.
Be aware, if you buy, use stop loss.
See other graphical analyzes below.

ES/MES Friday 15th Buy Pullback in Up ChannelEven though I am still not convinced that this rally is real, I will still participate in it on the next pullback for the next leg up for about 150 points. The all time high is just a skip away. After the last two weeks of sideways consolidation, and the Friday NFP gap up, I believe it will go sideways between 4625-4680 until the end of the week for the next impulse move higher.
The 200sma on the hourly is rising = Bullish position
The 21ema on the hourly is also rising = Bullish Position
I took a loss on my last trade trying to short even though there were no sell signals yet. Currently there are no sell signals as well and only strong buy signals.

SWING IDEA FOR ES 12/9Here is a swing trade idea. I will end the trade after the trendline break. I am closely watching PCC for put/call ratio. It went about .9 Thursday which caused the short squeeze and exactly as I thought this is a short squeeze- so I can see the price continue to rise especially since it gapped up.

Weekly Macro S&P 500 AnalysisThe 4270.00 level can contain selling through Q1, above which 4634.50 remains a 3 - 5 week target, 4864.25 likely over the next 3 - 5 months.
Upside, 4634.50 can contain weekly buying pressures, while closing above 4634.50 indicates the targeted 4864.25 by the end of February where the market can top out into Q2.
Downside, a settlement below 4270.00 signals 4113.50 within 2 - 3 weeks, secondary long- term support able to contain selling into later in 2024 and above which a longer-term bullish dynamic remains in effect over that time horizon.

12/8 Trading Plan - Thursday Recap and Day Ahead📊 Market Sentiment: Bullish
The current market sentiment is bullish, as indicated by various key factors. The closing prices are consistently above the Exponential Moving Averages (EMAs) for 9, 21, and 55 periods in both the 4-hour and daily datasets, highlighting a positive trend. Additionally, the market is maintaining levels above key support zones while approaching significant resistance levels. This bullish sentiment is further supported by global market trends, with most markets showing upward movement, robust crude oil prices, and strong yield performances.
🔄 Market Recap
November proved to be a bullish month, with the ES rallying over 450 points, demonstrating remarkable resilience. However, since November 20th, ES has been in a consolidation phase, oscillating within a narrow range of 4550-56 to 4575-80. Despite repeated tests of this range, a definitive breakout has yet to materialize.
📈 The Markets Overnight
🌏 Asia: Mostly up, Japan down a lot
🌍 Europe: Up
🌎 US Index Futures: Mixed
🛢 Crude Oil: Up strongly
💵 Dollar: Up
🧐 Yields: Up strongly
🔮 Crypto: Up
🌏 Major Global Catalysts
Japanese stocks continue their steep decline fall, the Yen continues to rally as traders expect the Bank of Japan will exit it’s longtime negative rate policy this month.
📷 Snapshot
Daily Data Sentiment Analysis
EMA 9, 21, 55: Similar to the 4-hour data, the daily data also shows a bullish sentiment with closing prices above the EMAs.
Closest Support and Resistance: The closest support level is at 4580, similar to the 4-hour data, and the closest resistance level is at 4632.
Overall Sentiment: Bullish.
4-Hour Data Sentiment Analysis
EMA 9, 21, 55: All are indicating a bullish sentiment as the closing prices are above these EMAs.
Closest Support and Resistance: The closest support level is at 4580, and the closest resistance level is at 4642.
Overall Sentiment: Bullish.
🔍 Key Resistance Levels
4755: A significant long-term target connecting August 2022 and July 2023 highs. It's a major magnet/target in the current market context.
4680-4685: Represents a re-test or slight overthrow of the August highs. It's crucial for validating the strength of the bullish trend.
4658: A critical resistance level that was tested on June 20th and July 25th, 2023. Previous failures to sustainably clear this zone led to a correction, making it the first major breakout zone above 4620-4625.
4642-4645: A key zone in the current market structure.
4620-4625: This represents the upper green dotted line in the chart, connecting the January 2022 COVID bull market high with the August 2022 high. This level was a target for some time and is now more likely to be breached due to significant basing.
🔍 Key Support Levels
4573 (and 4580): This zone capped rallies in the last week and a half, with multiple failed attempts to clear it. It's seen as a significant 2-week resistance cluster now turned into support.
4556-4558: A key zone tested multiple times (32 times in the last week), indicating a range of choppy trading between 4556 and 4580.
4540-4542: A multi-month level, it was key resistance in June and July 2023, and following a breakout, it has been acting as support.
4514: An important zone from mid-November.
4497: Serves as major support, back-testing the channel resistance dating back to highs of December 2022 and February 2023.
4450: The immediate backtest point of the line after the CPI announcement on November 14th.
📉 Support Levels
4556 (major), 4548, 4539-42 (major), 4530, 4524, 4520 (major), 4512, 4507, 4496 (major), 4485, 4475, 4463 (major), 4450 (major), 4443, 4436, 4431 (major), 4418, 4414, 4408 (major), 4399, 4389 (major)
📈 Resistance Levels
4565, 4573 (major), 4580 (major), 4590-93 (major), 4597, 4609, 4618-22 (major), 4633, 4640-42 (major), 4648, 4657 (major), 4666, 4680-84 (major), 4693, 4704, 4711 (major), 4722, 4727 (major), 4739-41, 4747, 4755 (major)
📝 Trading Plan
Bullish Scenario: If the market sustains above key support levels and breaches resistance levels, especially 4620-4625 and 4658, the bullish breakout trend may continue.
Bearish Scenario: A reversal below key supports, particularly below 4556, could indicate weakening of the bullish sentiment, leading to a potential bearish shift.
💡 Wrap Up
The market is showing bullish sentiment, but vigilance is key. Monitor resistance and support levels for changes in market dynamics.
Disclosure: This is not financial advice and is for informational purposes only. Please consult a professional financial advisor before making any investment decision.

dr/idr confirmation short ADRduring the ADR price confirmed short and analyzed dr lens data for a optimal entry for a potential downmove to 1.5std

12/7 Trading Plan - Wednesday Recap and Day Ahead📊 Market Sentiment: Neutral
The immediate market conditions lack a strong bullish drive, thus leaning towards neutrality in the short term.
🔄 Market Recap
November proved to be a bullish month, with the ES rallying over 450 points, demonstrating remarkable resilience. However, since November 20th, ES has been in a consolidation phase, oscillating within a narrow range of 4550-56 to 4575-80. Despite repeated tests of this range, a definitive breakout has yet to materialize.
📈 The Markets Overnight
🌏 Asia: Down
🌍 Europe: Down slightly
🌎 US Index Futures: Up
🛢 Crude Oil: Up
💵 Dollar: Down
🧐 Yields: Up
🔮 Crypto: Mixed
🌏 Major Global Catalysts
A ship ran aground in the Suez Canal, blocking one lane of the two-lane section and reducing transits by more than 50%. It’s since been cleared but the situation highlights ongoing difficulties in global shipping.
🔍 Key Structures
4755: A long-term target, connecting the August 2022 and July 2023 highs.
4680: Represents a re-test of the August highs.
4658: Crucial resistance encountered in mid-2023.
4639-42: A pivotal zone.
4618-22: The green dotted line on the chart, marks a significant trendline.
4573 (with 4580 just above): A two-week resistance cluster.
4556: A repeatedly tested support level.
4539-42: A notable horizontal zone, acting as a key resistance in mid-2023.
4520: A significant level from mid-November.
4497: A channel resistance tracing back to late 2022.
4450: The immediate backtest point post-CPI announcement in November.
4430: The bull market trendline from late 2022 to early 2023.
📉 Support Levels
4556 (major), 4548, 4539-42 (major), 4530, 4524, 4520 (major), 4512, 4507, 4496 (major), 4485, 4475, 4463 (major), 4450 (major), 4443, 4436, 4431 (major), 4418, 4414, 4408 (major), 4399, 4389 (major)
📈 Resistance Levels
4565, 4573 (major), 4580 (major), 4590-93 (major), 4597, 4609, 4618-22 (major), 4633, 4640-42 (major), 4648, 4657 (major), 4666, 4680-84 (major), 4693, 4704, 4711 (major), 4722, 4727 (major), 4739-41, 4747, 4755 (major)
📝 Trading Plan
Bullish Scenario: Maintain a long position as long as the 4556 support holds. Key supports at 4556 and 4539-42 safeguarding the upward trajectory.
Bearish Scenario: Prepare for a bearish shift if support at 4556 or 4542 fails. This scenario would involve breakdown trades below these support levels, with a high risk-reward ratio and the potential for substantial sell-offs.
💡 Wrap Up
As long as the support levels at 4556 (with the lowest being 4542-39) are maintained, there's potential for the ES to continue operating within its current range and possibly revisit levels like 4573, 4580, then dip to 4590, followed by another dip, before potentially approaching the vicinity of 4620. If the 4542 level fails, we might see the ES embarking on a downward trajectory, moving from one level to the next.
Disclosure: This is not financial advice and is for informational purposes only. Please consult a professional financial advisor before making any investment decision.

Daily AccountabilityWrong about yesterday saw the diveranges but went the wrong way. Still walk way with some profit.
Today: Short at demand exit at 240 supply zone. 240 Min RSI is looking weak so selling could keep going.

ES ShortI am expecting the weekly range to expand lower.
Today I expect buy stops to be taken out before the market goes to the low of the previous week.
I expect price to go to 4583 in the best case scenario and short there. Inside the 1H fvg.

Long and ShortA few levels of interest.
NPOC are created from Fixed Range pulls using Developing POC shifting points.
Every level has at least 2 confluences (OB, NPOC)
I recommend waiting for LTF market structure shift before entering positions.
Or look at order flow, delta even RSI could give you a solid confirmation.
Look for 5 min candle closes above/below the levels.

Futures Showing Weakness, It may be time to retest 4400All throughout this rally Bears have been calling for an inverse head and shoulders. We never got it and so many retail put buyers got absolutely REKT during the squeeze to 4600.
At this point though it looks like all of our overbought signals are finally rolling over and turning bearish. We cracked the rising channel that we painted after the squeeze to 4500 and are now firmly turning negative.
Based on seasonality and the upcoming fed meeting on December 13th I drew a blue water slide that takes us back to the 4400 area and the trendline that we cracked earlier in November. I am thinking we may end up sliding back down there and painting that Inverse Head and Shoulders after all, just later than everyone expected.
Just my opinions on the upcoming week and a half, perhaps its finally time that bears made some profit, assuming they didn't pig out and bust last month ;)
Good Luck, Safe Trades <3

Daily Accountability ES trend is sideways with a divergance on the 60 MIN RSI but RSI on 240 MIN is also bullish. Looking to go long on pull back at demand target at supply.
Trade Management:
Once entered wait till 1/2 way to target then move stop to break even. Manage stop on 60 Min with 13 EMA.
