NQZ2022 trade ideas
NQ Power Range Report with FIB Ext - 4/1/2024 SessionCME_MINI:NQM2024
- PR High: 18586.00
- PR Low: 18496.00
- NZ Spread: 201.0
Key economic calendar events
09:45 | S&P Global US Manufacturing PMI
10:00 | ISM Manufacturing PMI
- ISM Manufacturing Prices
Weekend gap up unfilled
- Climbing into prev week's highs
Evening Stats (As of 12:05 AM)
- Weekend Gap: +0.21% (open > 18465)
- Gap 10/30 +0.47% (open < 14272)
- Session Open ATR: 230.71
- Volume: 35K
- Open Int: 259K
- Trend Grade: Bull
- From BA ATH: -0.5% (Rounded)
Key Levels (Rounded - Think of these as ranges)
- Long: 18675
- Mid: 18106
- Short: 16963
Keep in mind this is not speculation or a prediction. Only a report of the Power Range with Fib extensions for target hunting. Do your DD! You determine your risk tolerance. You are fully capable of making your own decisions.
BA: Back Adjusted
BuZ/BeZ: Bull Zone / Bear Zone
NZ: Neutral Zone

NQ 4H Analysis - Range BoundThe SEED_ALEXDRAYM_SHORTINTEREST2:NQ 4H is currently in a range, marked by a shifting structure to the downside. Despite attempts to regain momentum, buyers have been unsuccessful, as demonstrated by the annotated sweep on the chart. We are now in a holding pattern, waiting for a direction to be chosen. While the overall trend remains bullish, we are in a cautious phase due to the market forming a balanced range.
There is a bullish internal structure flip, followed by a notably bullish 4H bar. However, the sweep above previous highs indicates that buyers were not ready to drive prices higher. Attempts to rebound on every previous internal lower high fell short, leading us back to where the internal structure flip occurred.
Buyers emerged again off of the internal structure flip high, but unless a higher low is formed and prior highs are finally surpassed, it seems that the momentum is dwindling. This could potentially signal the onset of buyer exhaustion and early indications of a larger timeframe pullback at the beginning stages.

Nasdaq market maker sell modelNasdaq looks ready to begin selling off. Here are a couple of things to look for.
-DXY looks strong and
-We are at all timed high and nasdaq looks like its running out of steam.
-The path of least resistance is where the liquidity hasn't been tagged, in this case its sell side liquidity.
-This is ICT's famous market maker sell model.
-Seasonal tendency, meaning every three months there is a shift in trend.
-As a scalper, i'm only looking for sells in these conditions.

Nasdaq possiable outcomes Nasdaq is in a downtrend but it has touched the trendline we drew four times that means its weakened so we could expect a possiable uptrend if it breaks the current hh otherwise i could contuniue down even more we could enter short if it breaks current LL

NQM2024 Analysis for a Bullish ScenarioBullish scenario. Sellside liquidity has been swept. Market showing displacement higher, after low made. New higher lows at discount should provide low risk high reward high probability trade setup to target buyside liquidity and premium fair value gap above the market.
Enjoy!


NQ Range (Week of 3-25-24)Final week of month and quarter, with a long weekend & Holiday (4 day week, low volume, look LONG). NAZ in NTZ (no trade zone) at mid channel, will need to move up/down near KL for better signal. Chart: Thick white arrow is upper target, Thick yellow is lower, NAZ will need to move away/passed form either Shaded Zone and if not go with Opposite Direction Trade at SZ. 18592& 228 are TLX's. These are reliable as targets and reversal zones. Thin white arrow is the U-Turn move away from the Danger Zone, this would be U-Turn number 30 or so and may happen in the O/N near 2-3am. 960 was the old DZ and we had a turn in O/N (3/17) which then set up Retest Long for Fed Day pop.


My NQ 4H Projection
4H short term bearish; medium term bullish; long run bearish so expect dump after all time high this time.

NQ1! - Could Be The One To Fall First...If we are to compare ES1! with NQ1!, you will be quick to realise that NQ1! swept buystops, creating the highs at 18709 before swiftly trickling lower, printing lower lows and lower highs whilst ES1! has already closed above previous all-time highs before retracing.
18500 with 18492 being the first target with a stretch for 18382.75 throughout the week
My philosophy is simple...
Fortify Michael J Huddlestone's concepts that I have studied to consistently predict where the market is more likely to go.
This includes;
- Market Structure
- Buyside/Sellside Liquidity
- Order Blocks
- Liquidity Voids
- Fair Value Gaps
- Optimal Trade Entry
- Premium/Discount Array
- SIBI/BISI
- Many More!
The strategies mentioned here are some of many that I use to implement into my analysis and over time, with consistency I aim to achieve a high degree of accuracy in the markets with the foresight and understanding to assess what went wrong when my bias is negated.
Credits;
- Michael Joe HUDDLESTONE
- Shawn Lee POWELL
- Toray KORTAN

MNQ SHORT POTENTIALthis is just a potential breakdown after a retest of highs in orange
TP1 at Pivot S1 with a potential of TP2 at S2 in New York Session
remember, only reason for short is due to the fact that it took a liquidity sweep at open
stop loss above sweep or recent high

NQ Power Range Report with FIB Ext - 3/28/2024 SessionCME_MINI:NQM2024
- PR High: 18507.00
- PR Low: 18477.00
- NZ Spread: 67.0
Key economic calendar events
08:30 | Initial Jobless Claims
- GDP
09:45 | Chicago PMI
Prev session closed flat with high vol
- Another inventory dip back inside week range
- Holding inside prev 3 session range
- Last trading day of month ahead of long weekend
Evening Stats (As of 12:05 AM)
- Weekend Gap: N/A
- Gap 10/30 +0.47% (open < 14272)
- Session Open ATR: 232.83
- Volume: 21K
- Open Int: 258K
- Trend Grade: Bull
- From BA ATH: -1.0% (Rounded)
Key Levels (Rounded - Think of these as ranges)
- Long: 18675
- Mid: 18106
- Short: 16963
Keep in mind this is not speculation or a prediction. Only a report of the Power Range with Fib extensions for target hunting. Do your DD! You determine your risk tolerance. You are fully capable of making your own decisions.
BA: Back Adjusted
BuZ/BeZ: Bull Zone / Bear Zone
NZ: Neutral Zone

Nasdaq 100 (NQ) Potential Support AreaShort Term Elliott Wave view in Nasdaq 100 (NQ) suggests that pullback to 18011.3 ended wave 4. The Index has turned higher in wave 5. Internal subdivision of wave 5 is unfolding as a diagonal. Up from wave 4, wave (i) ended at 18106.75 and wave (ii) ended at 18044. Wave (iii) higher ended at 18289.25 and wave (iv) ended at 18263.25. Final leg wave (v) ended at 18381 which completed wave ((i)). Pullback in wave ((ii)) ended at 18053.25 as a zigzag. The Index then resumed higher in wave ((iii)). Up from wave ((ii)), wave (i) ended at 18289.25 and wave (ii) ended at 18216.5. Wave (iii) higher ended at 18667.25 and wave (iv) ended at 18589.25. Final leg wave (v) ended at 18709 which completed wave ((iii)) in higher degree.
Wave ((iv)) pullback is in progress with internal subdivision as a double three. Down from wave ((iii)), wave a ended at 18492, wave b ended at 18626, and wave c lower ended at 18414.75. This completed wave (w) in higher degree. Rally in wave (x) ended at 18619 as a zigzag structure. Down from wave (x), wave w ended at 18439.25, and wave x ended at 18571.75. Expect the Index to extend lower in wave y to 18145 -18327 (blue box area) to complete wave (y) of ((iv)). From this area, the Index should resume higher or rally in 3 waves at least.

NASDAQ going upHuge uptrend still strong. Bull flag forming in the 4h TF. I scalped intraday. But swing position should be at the touch of the trendline+bull flag trendline. You can add more on the breakout of the bull flag.

NQ next stopsNext stops for NQ. Analyzed with secret method. Also we will get a new POC at the line I've drawn there. Not financial advice.

Nasdaq(NQM2024)My analysis on the Nasdaq is that the price will fall by taking the same ceilings on Tuesday and Friday and entering the FVG H1.

NQ Power Range Report with FIB Ext - 3/27/2024 SessionCME_MINI:NQM2024
- PR High: 18482.00
- PR Low: 18468.00
- NZ Spread: 31.5
Key economic calendar event
10:30 | Crude Oil Inventories
Maintain prev 2 session range
- Session open advertising potential to break highs
Evening Stats (As of 12:05 AM)
- Weekend Gap: N/A
- Gap 10/30 +0.47% (open < 14272)
- Session Open ATR: 237.41
- Volume: 17K
- Open Int: 254K
- Trend Grade: Bull
- From BA ATH: -0.9% (Rounded)
Key Levels (Rounded - Think of these as ranges)
- Long: 18675
- Mid: 18106
- Short: 16963
Keep in mind this is not speculation or a prediction. Only a report of the Power Range with Fib extensions for target hunting. Do your DD! You determine your risk tolerance. You are fully capable of making your own decisions.
BA: Back Adjusted
BuZ/BeZ: Bull Zone / Bear Zone
NZ: Neutral Zone

Deep Dive example, Pattern recognition development. How to train the eyes, to see the markets clearly and trade accordingly.
This is a example from my deep dive archive, making these, archiving them and studying them, and deeply understanding them has profound effects on your trading. This post is not about the style you trade. This is about how you study to be able to apply your methods, methodically with little effort in a flow state mentality.
I will share what i truly believe can get you there. It is not easy but if truly applied it can change your trading and even more so your life. I am firm believer to conquer the markets (Ie extract $ with a proven strategy consistently) you must become the the best version of yourself both physically and mentally. It is a battle and you must sharp and aware because anything can happen at any time! Develop your methodology and train like most won't.
1) Know your patterns, hand draw them on paper, jot down any rules, triggers, tp's. Try to really envision the pattern. Note the exact price action you would look for at trigger level. Note rules for stop management you would take. (@tntsunrise was a firm believer in hand drawing patterns to start to train your eyes to see them)
2) Draw the patterns on blank chart on @TradingView, I will attach video on how to do this exactly. Practice until all triggers and coordinates can be nailed to the tick, (use fib tools, click and drag feature etc.). Note exact same things, from rules, to trigger, price action, ema theory, volume, rsi etc. Save charts, (print these) This takes a lot of time to develop, think 1000 drawings to nail 1-2 patterns, this could be way higher, some take a lot of time, for me the butterfly was difficult to learn and apply, especially in low time frame.
3) Deep Dives, again this a boot camp for your mind. Set crazy goals= I am going to find 300 of each pattern I trade in 10 hours. I know 6 patterns = 1800 charts. This is daunting at first, Eg suggest walks, breaks, push ups, but really try get dialed in, You will hit a flow state, at some point. Start to see new things, for me this was low tf, 5 minute, 1 minute, them sub 1 minute time frame. This was exactly how I truly started to develop my unique strategy. I suggest you do this alone. I did my first 3 when my GF was away for family trip. I did several during covid. I have thousands of printed copies and several hard drive files. This is life changing, join Stockbee and see the results this has led to. Keep in mind Qullamaggie attributes a lot to Eg's trader development, he trades as big as it gets$$$
4) Cheat sheet play book. Hard copy, short, to the point, 1-2 examples. As time passes you will not need it. Make it, refine it, look to it often. While learning I kept a note form of this on my phone, ipad. Just immerse your mind in your set ups. One thing EG always said that stuch with me. Trade set ups not stocks or futures., Tntsunrise said much the same. Find clean patterns at important structure levels try to envision the markets in a rally base rally mode and know where to hunt for big money ideas. This is life changing skill set and most rewarding mentally and most of all with profits.
4) Discuss your patterns and share ideas, If you are trading a real system, with proven results this should not be hard. You need to see the patterns you trade, entries, results and when and why the patterns worked or didn't. You need to see this everyday in every timeframe for 3-6 months. This can fast track you in my personal opinion to being able to extract $ from the markets.
I will attach additional videos, charts so please come back to this post time to time to see additional thoughts. I will attach 1 set up, I have not decided which and all I ask is for your patience it will be be below.


Post FOMC VPOCThis is a great area to monitor price's reaction to - Buyers will be looking to defend this zone

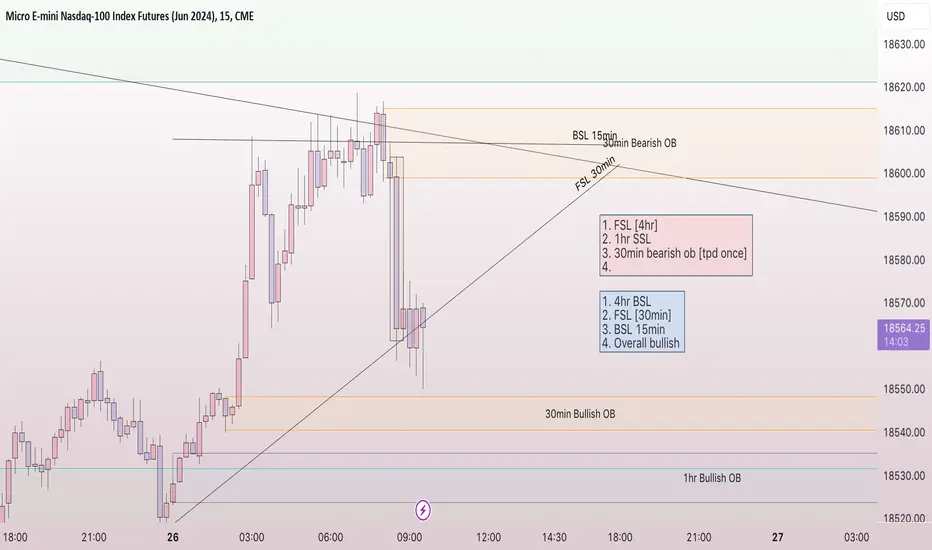
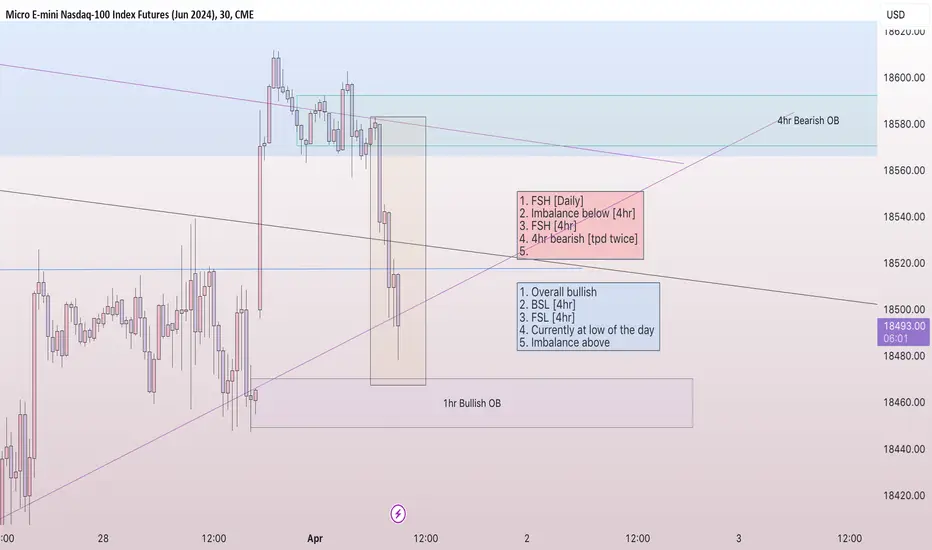
TRADING JOURNAL - 3.26.20243.26 Initial AM Buy Setup Analysis (Buy Limit Execution) - Morning Analysis based on ICT's 2022 Mentorship.