NQ - Do You Know What I Smell... MONEY!!Volatile week ahead and a lot of money is on the table to be made.
Interest rates has dropped .25 basis points and the opposite effect has happened with dollar denominated pairs.
The question is, will NQ bend it's knees??
NQU2024 trade ideas

UpdatedHi folks. Try to find a gap an sell. We take the all time high and we acumulate a lot from buysideliquidity.

NFPThis is the analysis for today. Be careful that at 08:30 we have NFP. The ugliest news on the stock market. Be careful that we may not have a trade today.

You found liquidity. Now here is what yo do with it.
In this chart price action I have marked out where previous types of liquidity existed.
At the left you can see there was an uptrend but this uptrend had no factors showing LOW liquidity. Only strong high liquidity. Using the rules below you can mark out liquidity levels and what to expect when price returns to these levels later on.
No indicator can do this for you. This is simple price action structure.
You can implement these rules into marking levels in your price patterns / shapes, if you like using those as well.
Welcome to the coffee shop everybody this is your host and Baristo Eric, and I'm here today to let you guys know about the difference between high liquidity and low liquidity pivots and when I say pivots I mean price levels in the market. I want you to keep in mind that this trick works on all time frames it doesn't matter what time frame you're looking at but it certainly works best if you're comparing the high time frame to the low time frame that you're trading on.
This is a price action trick and strategy that you do not need an indicator for. Which means you can never get this wrong as you long as you follow these rules but the minute you try using an indicator for this you're going to miss out on some important details.
Now obviously there's a few rules that you need to follow when you're looking for high liquidity or low liquidity pivots and in the image above you should be able to see it but in the text below I'll give you my breakdown of the 123 rule that you can really follow to understand what you're looking for.
Here's a few rules to follow:
1. Bullish candles make high pivots
2. Bearish candles make low pivots
3.the length of the Wick of the candle is the trigger to tell you what you're looking for.
You cannot find low or high liquidity in a market during the trend. You can only see it after the trend has finished and you are either currently ranging or you are in the alternate trend meaning you were in a downtrend and now you're in an uptrend or a sideways market. You want to look for these liquidity types in the previous trend but using the strategy in this video you can also find high and low liquidity in arranging markets simply by looking at the ranging market that previously took place.
The trick to finding liquidity in the market goes like this:
Finding Sell Liquidity (Resistance) in previous market moves.
If you were in a downtrend and now it has completed you can look backwards at that downtrend and find all the bullish candles that will reflect the rules you were looking for.
Look at the downtrend and find the bullish candles.
You want the bullish candles that had swing highs and their upper Wick is longer than their lower Wick.
If the previous market was an uptrend you simply wanna do the opposite:
and previously up trending market you wanna find all the bearish candles and those bearish candles need to have a swing low Wick plus the Wick on the bottom must be longer than the Wick on top. These will reflect your SUPPORT levels (Buy Liquidity)
One of the questions often asked is what do you do with these levels once you find them.
Once you find low liquidity levels you wanna mark them this way you can treat them as plausible breakout areas meaning that with low liquidity in these areas price will reach those areas later on and price will continue to move through them because there are very few participants trying to buy or sell in a low liquidity area.
High liquidity area however simply means there is a lot of volume lot of activity and when price reaches back to these levels that price will either stall or reverse at these levels.
High liquidity areas also mean that these are banks and institutions trading at these levels so price can pull away from it retest and then come back to it for a very large move initiated by that same level.

NasdaQ Day 04/06/24 The therapist says i need to express more.
Anyways,(my) daytrading levels on the Nasdaq for today.
Absolutely loving 18483.25.
Loving 18686 even more;
Planning to trade both/either side with these levels today; Also incorporating QQQ options, if price allows us.
If you see These levels and understand: Holla
If you have a different idea/opinion, let us hear it
Some wise ass told me," trading should be viewed like getting on a bus and get off at your stop. No need to reach the terminus.... Happy trading!

Asia Session Idea 06-04From the 15m TF, we see NQ rejecting the bearish FVG. If you drop down to the 5m TF you can see it doing the same with a 5m bearish fvg, while using a 5m bullish FVG as support.
If NQ trades above the CE of the bearish FVG (around 18,736), I will consider taking longs to Asia highs (18,746) and New York Session highs (18,753).
If it trades into the bullish fvg CE (18,723) & closes below it, I will consider taking shorts to Asia lows (18,696). Confirmation for me to take a trade is a strong candle close above or below the zones i've mentioned.

Path Ideas for NQNQ showed a little bit of weakness today after a big rally yesterday. It is back below a resistance level I have, but has also broken out of a bull flag. I expect it to bounce on a retest, but I think it can still go either way after that.

#Nasdaq Futures - 2 Paths depending on Unemployment Report *SMC*SMC = Smart Money Concepts - Find related Posts that provide explaination on how SMC highlights price action and how to predict what could happen in the market
This is in preparation for Thursday June 6 market.
As the Asian Market continues overnight. Its seems that there will be a slight decline. This decline will fall into a 4 hour Fair Value Gap (FVG) Designated by the large green box between the prices of 19028.25 - 19072.00. As it approaches the median of that 4HR FVG, there is also a 1 hour FVG Between 19043.75 - 19050.75. Smart money concepts sugggest that these fair value gaps will get filled with price action whichc is why I am suggesting the small decline during the asian market.
When the London market opens, we should see the price enter thes price zones mentioned above and possibly make a positive direction for a slowing until the Unemploymnt Claims Report is released. Considering the Unemployment Report is lagging, we may not see a large run but it should run the direction reflective of the report. However, the ADP report came out with a lot of losses and we saw major gains. So if the unemplyment claims are lagging, we could see another rise and a rise above the next liquidity point at 19108 from around 19050-19044.
If we were t o see a decline, I believe we would still see a run up from the area mention ed above as a "fake out" to make retail traders chase the price up and then it will hit the price of 19072 (top of the 4 hour FVG) and then start falling to fill in the rest of the FVG (19028) AND COULD CONTINUE LOWER... into the next fair value gap found in the 15 minute chart at 18950.25.
The only issue with it dropping is that it will encounter a Breaker along the way (Designated by the Blue Box - 19007.00 - 19024.50) Price may struggle through breaking below the low. If anything it may hit the median and start to stagnate before starting to move back up.
So in conclusion I've givent two road maps depensing on the data that comes out tomorrow
Personally, I have a feeling we'll see a bullish run with a laggin indicator with the Unemplyment claims hopfully breaking the new high.
Smart Money Ideas Previously Posted
Let me know your thoughts, good luck and good trading

And we are back for another day of tradingThis is what I think will happen today given that we are bearish. Usually the market does not get to buy side or sellside liquidity. Which means that I will not pursue him if he does not respect my strategy. I will not trade

Nasdaq $NQ EoM ReviewSimilar to ES, NQ has printed highs @ $19,023 before a minor retracement occurred.
Buystops in question: $19,023.25
Sellstops in question: $18,241.25

E Mini FuturesHello folks. I want to let you know that today we are bullish but I would like you to pay attention because today we have 3 or 4 news items that have a big impact on the market. I'll keep you posted in case anything changes.

Today we are bearishThat's the analysis for today. I want to let you know that we have high impact news that can affect the market. I will keep you posted in case there are any changes related to the analysis

NQ - trading session no.254:00pm - 5:00pm
good session today
Im using the ATR to determine the size (ticks) for my SL
PnL: +2 RR

NQ - Points of interest for a quick bullish scalpNQ keeps on grinding upwards.
I am cautious about shorts.
These are points of interest where I will consider quick 5-10 point scalps.

NQ - trading session no.244:00pm - 4:26pm
not enough volume in the market today, unfortunate
PnL: -2 RR
Weekly PnL: +4.5 RR

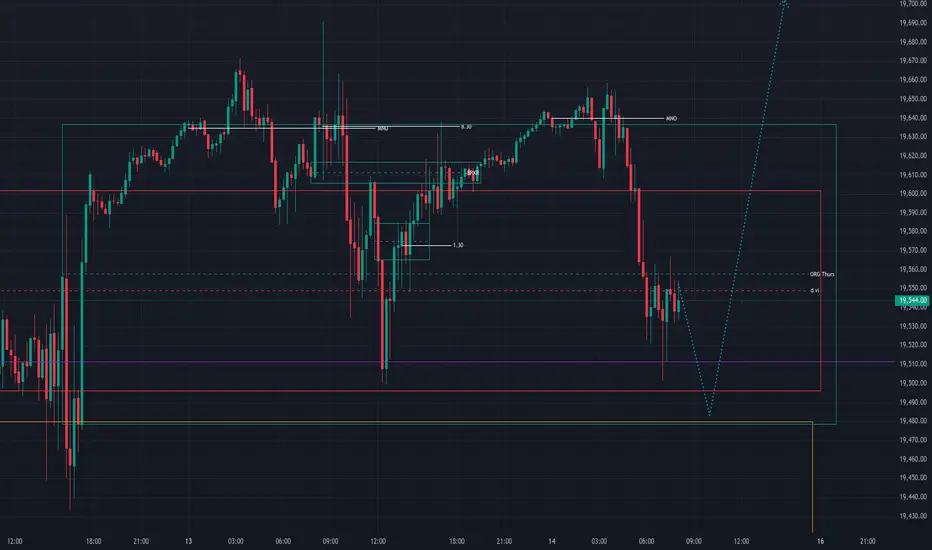
20240614 NQI anticipate one more move to the downside in order to perform d ss raid and reach to the bottom of the ORG Thursday before the reversal to the upside and move to the new HOW and making new HH. HI news at 10am will create spike in volatility. That is why the wicks of the downside candles can reach deeper than the supposed support level of the ORG Thursday bottom. Risk should be respected. I would like DXY to support this scenario by not moving above to raid it’s w REH today and symmetrical move of DXY to the downside.
NQ Power Range Report with FIB Ext - 6/14/2024 SessionCME_MINI:NQM2024
- PR High: 19615.25
- PR Low: 19592.50
- NZ Spread: 50.75
Key economic calendar event
11:00 | Fed Monetary Policy Report
Maintaining value in Wed highs
- Holding inside prev session range
- Prev session advertising reversal back towards 19400
Evening Stats (As of 1:15 AM)
- Weekend Gap: N/A
- Gap 10/30/23 +0.47% (open < 14272)
- Session Open ATR: 235.94
- Volume: 17K
- Open Int: 228K
- Trend Grade: Bull
- From BA ATH: -0.2% (Rounded)
Key Levels (Rounded - Think of these as ranges)
- Long: 19814
- Mid: 18675
- Short: 17533
Keep in mind this is not speculation or a prediction. Only a report of the Power Range with Fib extensions for target hunting. Do your DD! You determine your risk tolerance. You are fully capable of making your own decisions.
BA: Back Adjusted
BuZ/BeZ: Bull Zone / Bear Zone
NZ: Neutral Zone

Nasdaq 100 - Dawn of the New Age !Nasdaq 100 has been rallying since it bottomed out of the deep 2022 correction. The current rally is likely to continue for sometime however, one should not be ignoring the technical levels for support and resistance that we observe on the chart for short term profit taking and building positions on pull back.
The recent highs are supported by an unprecedented demand for AI hardware. I believe we are in phase 1 of a major super cycle that is likely to pan out over years perhaps decades.
The super cycle is likely to have three stages.
1. The race to build out the infrastructure
2. Companies that are able to build their software to deliver services and finally
3. Companies that convert stage 1 & 2 into cash flows.
It’s hard to predict companies that will have the most success in stage 2 and 3. However, as a strategy I plan to stick to the hardware providers and then owning a diversified portfolio of tech stocks.

OHLC Stat Mapping cooked today Usuall price delivery when bullish : you look to enter at or in close proximity of +M and target OPEN/opposing Manipulation or Distribution OR ADR when it is at logical level.

NQ Power Range Report with FIB Ext - 6/13/2024 SessionCME_MINI:NQM2024
- PR High: 19602.75
- PR Low: 19585.50
- NZ Spread: 38.75
Key economic calendar events
08:30 | Initial Jobless Claims
- PPI
13:00 | 30-Year Bond Auction
Continuing to push ATH
- 330+ point inventory run from Tue high
- Inching value above prev session high
Evening Stats (As of 12:05 AM)
- Weekend Gap: N/A
- Gap 10/30/23 +0.47% (open < 14272)
- Session Open ATR: 240.50
- Volume: 18K
- Open Int: 238K
- Trend Grade: Bull
- From BA ATH: -0.0% (Rounded)
Key Levels (Rounded - Think of these as ranges)
- Long: 19814
- Mid: 18675
- Short: 17533
Keep in mind this is not speculation or a prediction. Only a report of the Power Range with Fib extensions for target hunting. Do your DD! You determine your risk tolerance. You are fully capable of making your own decisions.
BA: Back Adjusted
BuZ/BeZ: Bull Zone / Bear Zone
NZ: Neutral Zone

NQ - trading session no.234:00pm - 5:00pm
good session today
- price action was very good today (trendy and not too choppy)
- also many good trades today
PnL: +3 RR

Market Crash - Cool CPI?CPI was 0.1% below expectations so technically a cool print, but pretty close to as expected. Initial reaction is bullish with TNX, VX, and DXY plummetting.

NQ Power Range Report with FIB Ext - 6/12/2024 SessionCME_MINI:NQM2024
- PR High: 19259.50
- PR Low: 19233.50
- NZ Spread: 58.0
Key economic calendar events
08:30 | Core CPI (3x)
10:30 | Crude Oil Inventories
14:00 | FOMC Economic Projections
- FOMC Statement
- Fed Interest Rate Decision
14:30 | FOMC Press Conference
Continuing to push ATH from prev session inventory run
- Holding value above prev session high
- >2.3% from daily 20 Keltner avg
Evening Stats (As of 1:45 AM)
- Weekend Gap: N/A
- Gap 10/30/23 +0.47% (open < 14272)
- Session Open ATR: 230.21
- Volume: 18K
- Open Int: 243K
- Trend Grade: Bull
- From BA ATH: -0.0% (Rounded)
Key Levels (Rounded - Think of these as ranges)
- Long: 19246
- Mid: 18106
- Short: 17533
Keep in mind this is not speculation or a prediction. Only a report of the Power Range with Fib extensions for target hunting. Do your DD! You determine your risk tolerance. You are fully capable of making your own decisions.
BA: Back Adjusted
BuZ/BeZ: Bull Zone / Bear Zone
NZ: Neutral Zone
