NQZ2018 trade ideas
NQ Power Range Report with FIB Ext - 3/26/2024 SessionCME_MINI:NQM2024
- PR High: 18542.50
- PR Low: 18529.75
- NZ Spread: 28.75
Key economic calendar events
08:30 | Durable Goods Orders
10:00 | CB Consumer Confidence
Tight NZ spread (initial range)
- Maintaining range of prev 2 session
- Daily liquidity grab (look below and fail)
Evening Stats (As of 12:05 AM)
- Weekend Gap: N/A
- Gap 10/30 +0.47% (open < 14272)
- Session Open ATR: 242.58
- Volume: 16K
- Open Int: 255K
- Trend Grade: Bull
- From BA ATH: -0.8% (Rounded)
Key Levels (Rounded - Think of these as ranges)
- Long: 18675
- Mid: 18106
- Short: 16963
Keep in mind this is not speculation or a prediction. Only a report of the Power Range with Fib extensions for target hunting. Do your DD! You determine your risk tolerance. You are fully capable of making your own decisions.
BA: Back Adjusted
BuZ/BeZ: Bull Zone / Bear Zone
NZ: Neutral Zone

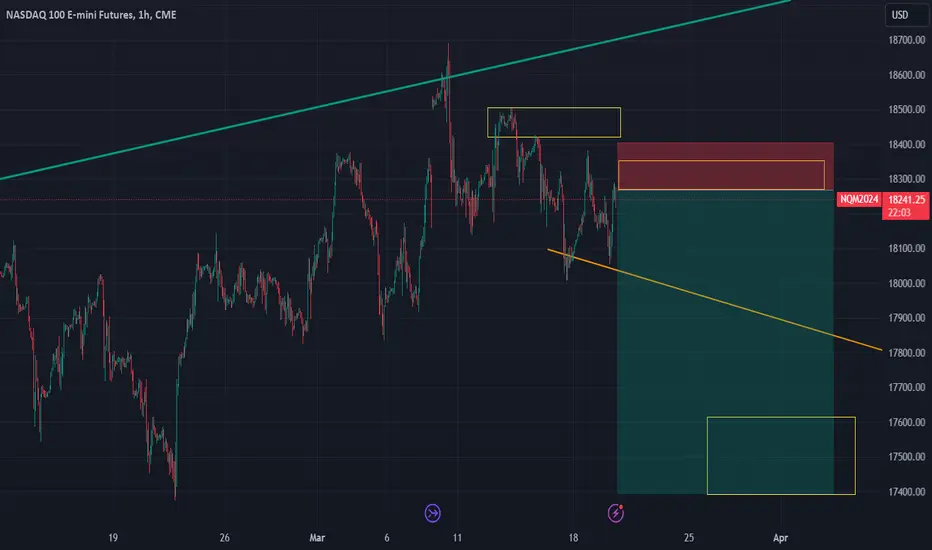
The Ideal Pullback for NQ Continuation Ideally we would like to see a two-legged correction into a level of demand for continuation of NQ.

Can the HOUSE CAPITALIZE ON THIS NQ 'TXTBOOK' SHORT...?CME_MINI:NQ1!
Top of the Morning HOUSE! I hope everyone is enjoying their weekend and staying productive...
I have developed this NQ SHORT as Buyers swept the Market HIGH and Sellers came in and dropped the market underneath a HUGE Daily Resistance Level...Here is what I want to see to go SHORT and catch this TXTBOOK break and retest play...Vibe w/ me
1) On Fri the Daily TF last Candle closed under the Daily Resistance Level ($18588.50) which is our 1st confirmation that we could get ready to go short... ***In order for me to go short Price needs to stay underneath this level of Resistance...
2) We have a minor Support level created on the 4Hr TF around ($18491.00) that we can clearly see buyers trying to defend...***I want to see sellers break this level of support with confirmed candle closures on the 30m TF and down... Also price needs to be trading underneath the RED V-Wap as a last min. confirmation...Its always better to be trading in favor of the colored VWAP....
3) Now if we can get these sequence of events to take place in the market then I will be compelled to enter the Market SHORT off of the retest of the failed Minor Support Level and target the unmitigated 4Hr/1Hr Demand Below... We can easily catch a solid +2.5-3R % Gain depending on your given management system traded...***This is a txtbook break and retest play!
***Remember Nothing in the market is set in stone, We simply play the long-term game of probability... However I am very confident in my reading of PA and how this particular asset moves...Still the market is pure sure randomness and every trade is unique that is why it's the probabilistic game we love to play...Yes PA is all about repeated patterns however the timing of that exact pattern to take place is unknown...So always manage your risk professionally!!
Now lets sit back N stalk like the saltwater CROC!!
#BHM500K #NewERA

Is NQ Ready for A Markdown?Using the Wyckoff cycle, NQ could be indicating it's ready for a markdown phase.

NQ Power Range Report with FIB Ext - 3/26/2024 SessionCME_MINI:NQM2024
- PR High: 18585.50
- PR Low: 18552.50
- NZ Spread: 74.0
Key economic calendar event
10:00 | New Home Sales
Starting week with daily inside print
- Ranging inside Fri and Thu range
Evening Stats (As of 12:05 AM)
- Weekend Gap: N/A
- Gap 10/30 +0.47% (open < 14272)
- Session Open ATR: 248.36
- Volume: 23K
- Open Int: 253K
- Trend Grade: Bull
- From BA ATH: -0.5% (Rounded)
Key Levels (Rounded - Think of these as ranges)
- Long: 18675
- Mid: 18106
- Short: 16963
Keep in mind this is not speculation or a prediction. Only a report of the Power Range with Fib extensions for target hunting. Do your DD! You determine your risk tolerance. You are fully capable of making your own decisions.
BA: Back Adjusted
BuZ/BeZ: Bull Zone / Bear Zone
NZ: Neutral Zone

NQ Weekly Levels (Mar25-28)Encouraged by a positive economic outlook and dovish signals from the FOMC, investors are diversifying beyond tech giants like NVDA & META. Confidence in the economy's resilience and the Fed's inflation management has broadened the market rally. Although the Mag 7 stocks continue to dominate XLF and XLE are near ATH and XLI remains strong. Small caps, which have lagged brutally look poised to play catchup. The SPX has gained 27% since late October, while NDX has gained 30%. We have a shorted trading week ahead with markets closed on Good Friday. Traders will look for clues for market direction from some Fed head speeches and PCE data at the end of the week.
SUMMARY
NQ posted a 2.77% gain last week after trading in a wide range of 655 pts.
NQ closed back at the top of the 4 week range near ATH after a 550 pt rally.
R2 = ATH (18709)
R1 = LTF 1.272 Fib X (18588)
S1 = 9 ema (18392)
S2 = 21 ema (18293)
Bias remains long but potential for rejection at ATH
Break below upward trendline would signal potential trend change.
Positive reation to FOMC. Dovish Fed + OK economy
Mag 7 had strong week minus AAPL & TSLA
XLE & XLF near ATH and XLI continuing to showing strength.
All dips are being bought
Shortened trading week & end of month
PCE on Thurs/Fri
Small caps on breakout watch again
RSI 59.05| VIX at 13.05 | 10 year 4.20%

My bias is on NasdaqAll in chart..!
I think the Nasdaq will make a small correction to its previous bullish 62-leg level

NQ Correction Incoming? The beginning of February is historically a strong month for stocks and indices. One thing however that I providing me some context that the market may see a correction in the near future is this massive rising wedge with bearish divergences.
I wouldn't be surprised if we saw one last move to the previous high (ugly high) to grab some liquidity and make its way down. The reason I don't quite like the current high is that it doesnt seem to be too much of a battle zone resistance. Generally, strong reversals happen with large wicks that trap traders on the wrong side of the move.
Currently, the market is still holding some bullish structure making higher highs, and buyers may want to see price move higher before taking profits.
My overall plan is to continue scaling into SQQQ towards the high of this move and hedge the portfolio in the case the market does correct between 5%-7%.
Good luck!

NQ Range (Week of 03-18-24)NAZ once again with magical lift in the O/N to offset the Friday sell off or the previous O/N Pump/Dump. Am I the only one has noticed this? Now we need to se if the typical predictable 2nd half of the Friday-Monday Long Only pattern plays out today. Getting tricky as the pattern use to be Friday Long and Monday Long, previous 2 Friday's have gone lower with last Monday sideways to lower. Open Range/Drives usually sell off 1st. Other patterns: Whenever the NAZ has struggled to get lower over 2-4 days, it usually retraces back up it 1 day or so. My Friday Post was Long with the lower range as 2nd option. Many times I am early on a call and the exact opposite will play out prior to a bigger move in my original direction. Today and Tuesday may be huge moves to upside prior to Fed Day. Chart: 4HR, YTD Channel, Yellow arrow is break out range, Dots are targets and reverse trade if hit, 18345 & 17960 are KL's, 19376 & 18154 are TLX's. So far nothing has changed except we had 2 Friday Reg Sessions that sold off. The O/N is still in charge and the Boss, play this range 1st and do not expect much from the Reg Session. The Reg Session PA has been shaky, jerky and sloppy.


TRADING JOURNAL - 3.21.20243.21 Initial AM Sell Setup Analysis (Sell Limit Execution) - Morning Analysis based on ICT's 2022 Mentorship.

NQ UpdateOverbought and AAPL is dead red today. It's down so much, it's knocked over a dollar off of QQQ.
I was gonna fade the gap this morning, but bought a few AAPL puts instead, glad I did, looks like I'll make some money this week after all, lol. Next time, I will NOT underestimate the Village Idiots (the Fed) and just go long. Oddly, I'm glad I didn't because AAPL would have been my pick.

NQ - PermaBull looking for ShortsNQ - Sat here for a good portion of the London session and observed price without pushing the button. I watched NQ return at the daily open/settlement price. The 580 level on NWOG has remained significant throughout the week. Reflecting on the week, particularly yesterday, it brings to mind ICT weekly profiles. S&D bearish scenario: Thursday breaks the high, with Friday continuing to push lower. Notably, Tuesday marked the low of the week. Conversely, there's a Classic Bullish weekly profile where Thursday sets a new high, followed by Friday pushing lower to close the week. With that said, these bears :bear: signals may not be entirely reliable. The market closed yesterday with the higher timeframes still indicating a bullish sentiment. It's easy to get fixated on the possibility of a major dump on Friday #TGIF, but the recently closed 3-hour candle doesn't scream bearish. We may continue to push UP, way UP.

NQ Power Range Report with FIB Ext - 3/22/2024 SessionCME_MINI:NQM2024
- PR High: 18590.75
- PR Low: 18569.00
- NZ Spread: 48.75
Key economic calendar event
09:00 | Fed Chair Powell Speaks
Prev session closed virtually flat
- QQQ daily gap still unfilled
- Holding above prev session close
- Huge upper wick on prev session daily print
Evening Stats (As of 1:35 AM)
- Weekend Gap: N/A
- Gap 10/30 +0.47% (open < 14272)
- Session Open ATR: 258.68
- Volume: 27K
- Open Int: 251K
- Trend Grade: Bull
- From BA ATH: -0.6% (Rounded)
Key Levels (Rounded - Think of these as ranges)
- Long: 18675
- Mid: 18106
- Short: 16963
Keep in mind this is not speculation or a prediction. Only a report of the Power Range with Fib extensions for target hunting. Do your DD! You determine your risk tolerance. You are fully capable of making your own decisions.
BA: Back Adjusted
BuZ/BeZ: Bull Zone / Bear Zone
NZ: Neutral Zone

NQ - Observing BuysideMy philosophy is simple...
Fortify Michael J Huddlestone's concepts that I have studied to consistently predict where the market is more likely to go.
This includes;
- Market Structure
- Buyside/Sellside Liquidity
- Order Blocks
- Liquidity Voids
- Fair Value Gaps
- Optimal Trade Entry
- Premium/Discount Array
- SIBI/BISI
- Many More!
The strategies mentioned here are some of many that I use to implement into my analysis and over time, with consistency I aim to achieve a high degree of accuracy in the markets with the foresight and understanding to assess what went wrong when my bias is negated.
Credits;
- Michael Joe HUDDLESTONE
- Shawn Lee POWELL
- Toray KORTAN

NQ Power Range Report with FIB Ext - 3/21/2024 SessionCME_MINI:NQM2024
- PR High: 18563.25
- PR Low: 18526.50
- NZ Spread: 82.25
Continuing momentum following FOMC
- Pushing supply back near ATH
- Above prev session high
Key economic calendar events
08:30 | Initial Jobless Claims
- Philadelphia Fed Manufacturing Index
09:45 | S&P Global US Manufacturing PMI
- S&P Global Services PMI
10:00 | Existing Home Sales
Evening Stats (As of 12:05 AM)
- Weekend Gap: N/A
- Gap 10/30 +0.47% (open < 14272)
- Session Open ATR: 265.68
- Volume: 26K
- Open Int: 253K
- Trend Grade: Bull
- From BA ATH: -0.6% (Rounded)
Key Levels (Rounded - Think of these as ranges)
- Long: 18675
- Mid: 18106
- Short: 16963
Keep in mind this is not speculation or a prediction. Only a report of the Power Range with Fib extensions for target hunting. Do your DD! You determine your risk tolerance. You are fully capable of making your own decisions.
BA: Back Adjusted
BuZ/BeZ: Bull Zone / Bear Zone
NZ: Neutral Zone

NASDAQ(US100):🟢Possible scenarios🟢(Details on Caption)
Hello Traders
Outlook:
Daily Chart Summary:
NASDAQ's recent action:
Cleared sell-side liquidity in the daily Fair Value Gap (FVG).
Activated bearish breaker block by closing below 18233.50.
Bullish Scenario:
4-hour chart insights:
Trend line liquidity intact.
Buy-side liquidity remains untouched.
SMT with S&P500 and Dow Jones trend supports upward potential.
Bearish Scenario:
Concerns:
Activation of daily bearish breaker block.
Presence of order block with Fair Value Gap (FVG) on the 4-hour chart.
Explore
By examining the NASDAQ daily chart we can figure out, that the price purged the sell-side liquidity that formed inside the daily FVG. On the other hand, the price activated the bearish breaker block by closing the daily candle body below 18233.50.
Up to this point, I mentioned the primary characteristics of bullish and bearish scenarios, Let's go deeper and continue.
The first scenario (I follow this scenario) is bullish, Here in the NASDAQ (US100) 4-hour chart we can see the created trend line liquidity and left buy-side liquidity untouched. In addition, there is an SMT with S&P500 and Dow Jones. This alignment gives us added confidence in the potential for the price to target the buy-side liquidity.
The second scenario is bearish. As I mentioned the price activated the daily bearish breaker block and also there is an order block with FVG that may push the price lower. The bullish FVG above sell-side liquidity can be our first target in this scenario.
💡Wait for the update!
🗓️17/03/2024
🔎 DYOR
💌It is my honor to share your comments with me💌


TRADING JOURNAL - 3.20.20243.20 Initial AM Sell Setup Analysis (Sell Limit Execution) - Morning Analysis based on ICT's 2022 Mentorship.

NQM2024 March Bullish Swing TradeAfter having an Immediate Rebalance on the Monthly chart and testing a Weekly SSL pool, I'm expecting bullish expansion beginning the third week of March.
Entry: 18029
Stop loss: 17875
Take Profit #1: 18691.25
Take Profit #2: 19450

NQ_F / QQQ Descending Triangle Into Demand / FOMC Analysis We see NQ forming a descending triangle into a key demand zone of 18165-18075 along with a key support zone of 18100-18060 that's been holding for some time now. With FOMC tomorrow, this will be a key zone, along with the descending pattern.
Below 18060 puts targets below into play.
Break above the descending triangle puts ATH back into pay.

watch for short*The content on this analysis is subject to change at any time without notice, and is provided for the sole purpose of assisting traders to make independent investment decisions.