NQU2019 trade ideas

NQ what is the outlook for 2024Looking at the January 2022 (Yellow Bars) and 2023 (Red Bars) moves and overlaying them onto 2024 chart we can clearly January corrects the seasonal or Santa rally the question then what happens after that, the convergence is at 15278/15560, that will be decision time.
I will post a daily and weekly chart to see if i can answer the conundrum.

NQ daily outlook with nq posting all time high last week and we have friday closing in strong red showing bearish volume we can expect some down side movement so our point of interest if we break our poi we will see further down movement if we reject and have a daily closing above our poi we can target the previous high on the daily . thank you much trade responsibly trade at your own risk.

NQ1! BEARISH BIAS RIGHT NOW| SHORT
Hello,Friends!
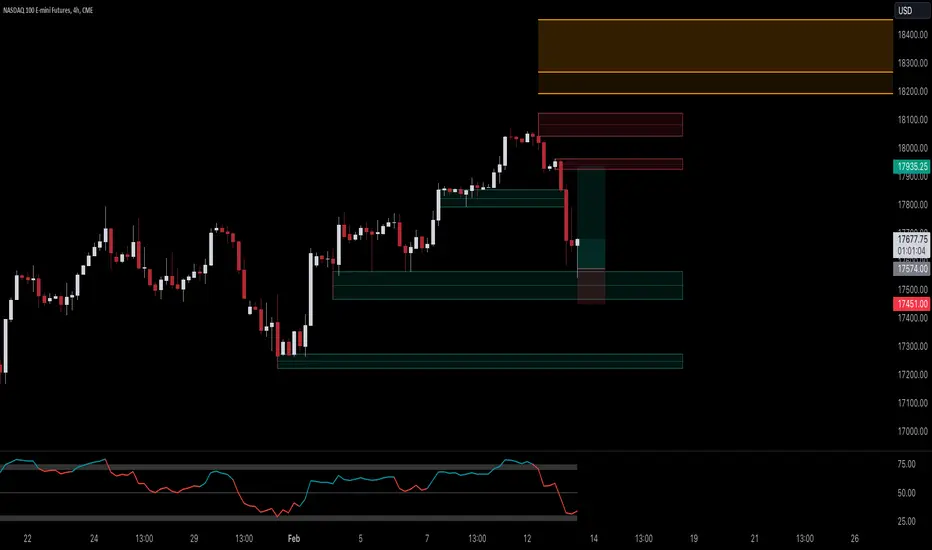
NQ1! is making a bullish rebound on the 2H TF and is nearing the resistance line above while we are generally bearish biased on the pair due to our previous 1W candle analysis, thus making a trend-following short a good option for us with the target being the 17861.25 level.
✅LIKE AND COMMENT MY IDEAS✅

most simple strategy: timingbuying the NQ every day at 10 am expect wednesday and hold till close gained on backtest 90K for the last 6 month
shorting the NQ from monday or tuesday close on a market above 200 ema and not rising
and holding the position till next day
10 - 11 am
showed some nice profits.
Simply look at prior week during which days the biggest gaps happend then use this knowledge to plan the week ahead.

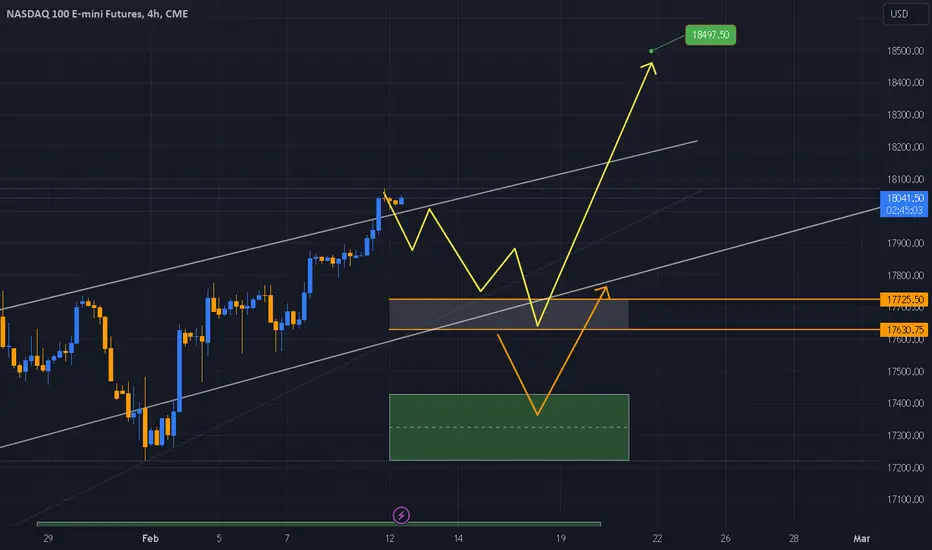
NQ forecast for week commences 19/02/24Inside to outside liquidity. Balancing the price and competing MMSM

I'm looking for lower prices going into MON and TUEWant to see price draw down into sell side liquidity on Monday or Tuesday we have been making all time highs I'm not bearish just expecting a retracement. If we start taking out lows on higher daily time frame then I will be bearish, until then indices to the moon!!!!!

NQ september 23 clonelet say we clone september 15 option expiration move to the downside.....to me it fis very well the tipe of correction expected, the reason is that in anycase inflation is coming back for several reason. on jennuary 17 the price had an huge run to the upside leaving wednesday 16 closure open, at the same time market after FED decision was supposed to fall wich did not happen due to mega cap earnings

$NQ - shows more weakness vs $SPX or $DIA 👇▹Today's candle is bearish engulfing w/ increased selling pressure.
▹Bearish RSI divergence + MACD + Stoch intact.
▹Rising wedge + vol shelf.
➢ I believe, next week it'll fail to hold 20ema & 🪂📉

QQQ to 20,000Tech is just super strong and though in the overvalued range, I think it is likely going to run up to at least 20,000 before summer based on the 1.6 fib extension. Now, I still think we need a confirmation of continued bullishness next week. If we continue above the trend line, then I see no reason that it does not stop until 20k.

Using UT Bots sell/buy with the anchored vwap and 200 ema.Here I explain how to use ut bots buy and sells with anchored vwaps and the 200 ema.

Nasdaq: Exhausted 🥱The upward momentum of the Nasdaq appears to be weakening. In the light of our primary scenario, this is to be welcomed, as the last all-time high should ideally be surpassed only marginally the price enters the well-deserved correction of its magenta-colored wave (ii). If the Nasdaq shoots significantly further north, the magenta-colored wave (iii) could already be developed; we assign a probability of 38% to this short-term bullish alternative.

NASDAQ: Is it time to go short?Analyzing the NASDAQ, we see several significant factors. The quote is approaching weekly highs, and the performance over the last five days is positive, with a 0.35% increase, indicating strength in the market. However, the volatility over the last five sessions is higher than the three-month average, signaling a period of uncertainty and fluctuations. Nevertheless, both in the previous semester and in the last twenty sessions, a bullish price trend is observed, suggesting a positive long-term trend.
Looking at support and resistance levels, the main support area is at 17480.0, while the resistance area is at 18040.0. A potential trend change could occur with a drop below the support area at 17040.0, indicating a possible reversal of the bullish trend. The net speculative positions of traders on NASDAQ 100 futures have decreased compared to the previous week, reflecting some uncertainty among operators about future market prospects.
Monitoring the performance of the bond market is crucial, as an increase could shift demand towards bonds at the expense of stocks. Currently, the annual yield of the US ten-year treasury is increasing, which could influence the technical analysis of the NASDAQ.
Furthermore, a more detailed analysis at the H4 timeframe level reveals that the market is oscillating around a supply area, suggesting the possibility of a structural change. An approach could be to wait for a change at M15 and then consider entry on the retest of an M15 supply area, with a target at 17560. If the price closes completely outside the M15 supply area, it could change the perspective, requiring further confirmation before deciding on operations.
In conclusion, although the NASDAQ shows signs of strength in the short term, it is essential to evaluate volatility and support/resistance levels. Trader positions and the performance of the bond market provide further insights into market sentiment and future prospects. Greetings and happy trading to all.

NQ Power Range Report with FIB Ext - 2/16/2024 SessionCME_MINI:NQH2024
- PR High: 17960.00
- PR Low: 17944.25
- NZ Spread: 32.25
Key economic calendar events
08:30 | PPI
Inching above Wed's high, prev session close
- Daily print, 17600 pivot long
- Discount margins raised for PPI
Evening Stats (As of 1:25 AM)
- Weekend Gap: N/A
- Gap 10/30 +0.47% (open < 14272)
- Session Open ATR: 223.72
- Volume: 21K
- Open Int: 286K
- Trend Grade: Bull
- From BA ATH: -1.0% (Rounded)
Key Levels (Rounded - Think of these as ranges)
- Long: 18106
- Mid: 16963
- Short: 16391
Keep in mind this is not speculation or a prediction. Only a report of the Power Range with Fib extensions for target hunting. Do your DD! You determine your risk tolerance. You are fully capable of making your own decisions.
BA: Back Adjusted
BuZ/BeZ: Bull Zone / Bear Zone
NZ: Neutral Zone

NQ Trade Plan 02/16 - Bullish & Bearish ScenariosLooking at Hourly chart there's bearish divergence and if we fail to take over yesterday's high shorts are in play. But if Prices moves up with volume, RSI will likely make a new high as well and bearish divergence will be nullified hence we are ready to trade both sides of the market and grab potential 50+ point moves in either direction
Trade Plan 02/16 (After NY Open)
a. If R1 Holds after 8am (news), go long on retracement
from yesterday's breakout zone targeting 18040
b. If we reject from R1 and fail to hold 17890
on retest, go short targeting 17820
c. No trade in any other scenario

NQ Range (02-14-24)NAZ is 250 points off yesterday low and that came in final 30 minutes of close and O/N, look familiar? The Yellow arrow is O/N Range and this is the range for break out (the O/N is the BOSS). NAZ may have hard time passing 17850, KLOD is 17731, FA;s are Orange Zones and all over the place (targets). White TL is Long above and Strong Short below. Expect a U Turn up at some point and do not fight it, if no U Turn then lower we go (Until Friday to Tuesday or Wednesday low volume prop up). Holiday on Monday, expect a lift or drop offset. Today is a key day, I will update on Teams.

MNQ SellCME_MINI:MNQ1!
1. 5 Minute chart was below 5x5 DMA.
2. Price was approaching COP levels (Fibonacci Expansion Levels)
3. The Orange level is a D-Level (Confluence Level) of a 38.2 & 61.8% Retracement.
- This happens in the direction of a trend. In this case, the Hourly uptrend had a level where the 38.2 & 61.8 both met at the same price which is an indication to me that there's a higher probability of price reacting or reversing at that price level.
4. 30 minute was below the 25x5 DMA and MacD confirming the downtrend.

NasdaqAttention! 🚨
This technical analysis is for informational and educational purposes only. It does not constitute financial advice. Remember to always research and consult with a professional before making investment decisions. Good luck! 📈💼🚀 I
f you found this analysis helpful or support my work, consider making a donation via Binance Pay: 57841095
Thank you for your support! 🙏💰
NQ1! NAS100 NADAQ 12.02.2024please make sure of them and do not risk, this is our analysis and ideas.
Please observe the capital carefully and do not risk more than 1% of your capital
Good luck to everyone
NQ Trade Plan 02/15 - Bearish & Bullish ThesisTrade Plan 2/15 (After NY Open)
a. If R1 gets rejected, go short on retest
failed of second attempt after 8:40am
b. If Wednesday breakout gets tested and holds,
go long for yesterday's highs and R1
c. If Wednesday Breakout area fails to hold
after 9am, go short on retest and failure targeting S1

NQ Power Range Report with FIB Ext - 2/15/2024 SessionCME_MINI:NQH2024
- PR High: 17881.50
- PR Low: 17865.75
- NZ Spread: 32.25
Key economic calendar events
08:30 | Initial Jobless Claims
- Retail Sales (2x)
- Philadelphia Fed Manufacturing Index
Maintaining Tuesday's range
- Holding prev session highs
Evening Stats (As of 12:05 AM)
- Weekend Gap: N/A
- Gap 10/30 +0.47% (open < 14272)
- Session Open ATR: 226.51
- Volume: 19K
- Open Int: 296K
- Trend Grade: Bull
- From BA ATH: -1.3% (Rounded)
Key Levels (Rounded - Think of these as ranges)
- Long: 18106
- Mid: 16963
- Short: 16391
Keep in mind this is not speculation or a prediction. Only a report of the Power Range with Fib extensions for target hunting. Do your DD! You determine your risk tolerance. You are fully capable of making your own decisions.
BA: Back Adjusted
BuZ/BeZ: Bull Zone / Bear Zone
NZ: Neutral Zone

2024.02.14 NQ AMSI anticipate downside move until around 9.30. => if no new low of the day around that time=> one more upside leg is anticipated

NQ Power Range Report with FIB Ext - 2/14/2024 SessionCME_MINI:NQH2024
- PR High: 17706.00
- PR Low: 17681.25
- NZ Spread: 55.25
10:30 | Crude Oil Inventories
Found inventory around 17600
- Trading inside prev session lows
- Maintaining range from Feb 7
Evening Stats (As of 12:05 AM)
- Weekend Gap: N/A
- Gap 10/30 +0.47% (open < 14272)
- Session Open ATR: 228.07
- Volume: 21K
- Open Int: 296K
- Trend Grade: Bull
- From BA ATH: -2.4% (Rounded)
Key Levels (Rounded - Think of these as ranges)
- Long: 18106
- Mid: 16963
- Short: 16391
Keep in mind this is not speculation or a prediction. Only a report of the Power Range with Fib extensions for target hunting. Do your DD! You determine your risk tolerance. You are fully capable of making your own decisions.
BA: Back Adjusted
BuZ/BeZ: Bull Zone / Bear Zone
NZ: Neutral Zone
