posted a bit late but short on nas100looking for a short on nas after the break out downwards from my trend line I marked.
NQM2017 trade ideas

NQ - Healthy Retracement??Very similar price action to ES, just with a few extra signatures.
I will be awaiting more data for me to make a clear decision where price action is most likely going to draw to.


Small Account Challenge Day 11 Recap - ES NQ RTY NVDAA recap for today's action and trades. I had a decent winner on IWM puts, but chose to hold rather than taking profit. I'm expecting some more downside tomorrow but we'll see how it goes.


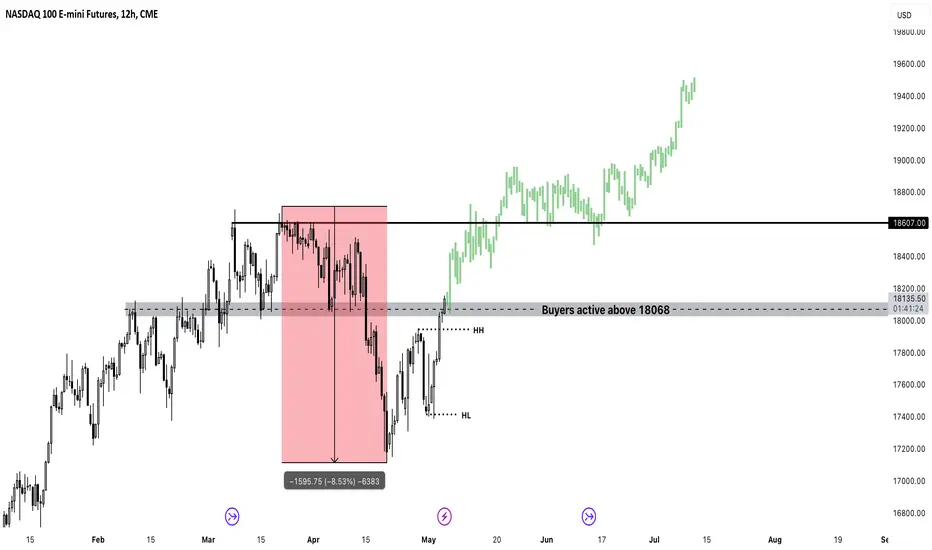
NASDAQ Uptrend Continuation Nasdaq 100 has fallen by 8.53% since its previous high.
The market has now created a new higher high and higher low signalling strong bullish momentum. If price can stabilise above 18608, we can see price target all time highs.

Market Health Update For CurrenciesStrong market trend on most pairs at the moment will little to no signs of a reversal setup at this time. Market is showing exhaustion so I'm cautious of entering a position.

Long MNQAlgo says go long with a possible 2 entry if SL is hit. I may be taking profit at 50% target


E Mini AnalysisFrom this gap the market will be bullish. I want to let you know that we are off session but you can look for a market structure shift and you can enter buy. We are bullish

NQ Power Range Report with FIB Ext - 5/28/2024 SessionCME_MINI:NQM2024
- PR High: 18956.00
- PR Low: 18905.00
- NZ Spread: 114.0
Key economic calendar event
10:00 | CB Consumer Confidence
Holding above Friday's highs
- High vol session open value decline
- Wide PR/NZ spread
- HIgh volume open from long holiday weekend
Evening Stats (As of 12:05 AM)
- Weekend Gap: N/A
- Gap 10/30/23 +0.47% (open < 14272)
- Session Open ATR: 235.95
- Volume: 95K
- Open Int: 250K
- Trend Grade: Bull
- From BA ATH: -0.5% (Rounded)
Key Levels (Rounded - Think of these as ranges)
- Long: 19246
- Mid: 18106
- Short: 17533
Keep in mind this is not speculation or a prediction. Only a report of the Power Range with Fib extensions for target hunting. Do your DD! You determine your risk tolerance. You are fully capable of making your own decisions.
BA: Back Adjusted
BuZ/BeZ: Bull Zone / Bear Zone
NZ: Neutral Zone


Can the HOUSE be skilled and catch this Counter Trend SHORT...?CME_MINI:NQ1!
“Never give up, never give in, and when the upper hand is ours, may we have the ability to handle the win with the dignity that we absorbed the loss.” -Doug Williams
As I've been studying PA on the Daily TF, it seems as if we have finally hit exhaustion in the market for buyers as their job may have been complete. I was lookin at a Potential SHORT that the HOUSE may be able to capitalize on... Here's what I would like to see in PA in order to enter SHORT...
1) As 1Hr Demand Zones build up & Supply Fails, The first level of demand I need to see fail is pricing around ($18678.00) which would indicate the first sign that sellers may be present and could be ready to start the Market Correction...
2) Once we get the first 1Hr Demand Failure and we get confirmed candle closures underneath pricing ($18678.00), I want to see sellers push price down towards Daily Support Level ($18623.00)...
3) This is a very important Key.....Once we get to the Daily Support Level ($18623.00) There is a huge 1Hr indecision candle rii underneath that level that I want to see sellers push price deep into and have confirmed candle closures inside the 1Hr Candle and underneath Daily Support Level...
****I need to see sellers present with confirmed candle closures under the Daily Support Level on the 30m TF and below in order for to me place my limit...
4) If and when we can get the sequence of events to take place in PA then I will be compelled to go SHORT playing the retest of Daily Support Level pricing around ($18623.00) & targeting the resting SSL below / 1Hr demand zone EQ pricing around ($18490.50) roughly around 530 pts in our favor!!
5) This is a counter trend SHORT so we need to be very skilled in our approach... Lets stay focused!! *** Almost forgot Price needs to be trading underneath the RED V-WAP in order for me to enter SHORT as-well as a last min. cherry on top confirmation!!
Remember when it comes to FRM (Financial Risk Management) our job is to manage the downside costs of printing High side returns of $$$ consistently... Let's Step!!
Stay Focused & Reach Excellence!!
#BHM500K #NewERA #Champions

Elliott Wave Analysis Expects Nasdaq Futures (NQ) Continue HigheShort Term Elliott Wave in Nasdaq Futures (NQ) suggests the rally from 4.19.2024 low is in progress as an impulse. Up from 4.19.2024 low, wave ((i)) ended at 17949 and dips in wave ((ii)) ended at 17386. The NQ extended higher in wave ((iii)) with internal subdivision as another impulse in lesser degree. Up from wave ((ii)), wave (i) ended at 18348 and dips in wave (ii) ended at 18165. Wave (iii) ended at 18760, wave (iv) ended at 18545, and wave (v) ended at 19023 which completed wave ((iii)).
Wave ((iv)) pullback did a zig zag Elliott Wave structure. Down from wave ((iii)), wave (a) ended at 18802 and pullback in wave (b) ended at 18933. Final leg wave (c) completed wave ((iv)) at 18621 low. The future rallied again in wave ((v)) ending an impulse as wave (i) of ((v)) at 18956 high. Near term, as far as pivot at 18621 low stays intact, expect a correction in 3 or 7 swings in wave (ii) before resuming to the upside in wave (iii) of ((v)). It expects short term upside in ((v)) towards 19117 – 19270 area as minimum extension, while dips remain above 18623.85 low. Alternatively, it can do double, if break below 18623.85 low as ((iv)) before turning higher.

NQ Scalping Zones 5/28NQ Weekly Outlook
Upside Targets:
* 18,929--19,000--19,100
Downside Targets:
*18,826--18,758--18,693
Daily Trend Tracker -
*NQ? *DXY- *VIX- *US10Y-

a short on nas100 seeing the bounce of the resistance zone I marked, looking for it to go back down to the previous support and retest or break it and going lower but Ill be monitoring it.


G-MAN SETUP SMB CAPITAL G-MAN Setup in the playbook page 325.
he breaks down one of his best setup entry ,exit and how to get into the trade , using the Tape is one of the most important element to the trader looking to add this setup to the playbook setup.

NASDAQ (NQ, NAS100) Weekly Forex Forecast.... BULLISH!May 27 -31st
Looking for price to reach the Draw on Liquidity at 19,023.00

NQ - trading session no.124:00pm - 5:00pm (session)
I have now decided that only 4 trades per day is not enough
--> up to 10 trades ig; Ill have to take a look at the max loss per day then tho
overall a good day; learned sum stuff:
- watch the overall size of pullbacks!
- wait for the right conditions!!!
PnL: +1 RR

nasdaq droolookign at the market today we haved made a new range, and we are in the top part of it.
short today.
entry 1 in blue, red stop, target green.
entry 2 in blue (top line).,
have fun
Elektra 33

NASDAQ**NASDAQ:**
New all time high at 19.024.
The forecast is for the pedestrian to descend to the bottom of the canal.
