GOLD (GC1 Futures) Mid Term UpdateAs a refresher, in the previous weeks, I posted a mid term chart for GOLD - based on the Futures charts - which suggested a move down to a previous support area (around 1745 LONGTERM). That chart can be found here:
GOLD has now moved around 100 points from the suggested entry point. The sell off in recent days has been very intense; this is due to the relentless strength of the US dollar, supported by reasonably bullish data releases which support the FED's "higher for longer interest rates" narrative.
There may have been a turning point yesterday.
NFP released, showing a HUGE gain of over 300K jobs, massively exceeding the expected 170K job forecast, however, the picture is not so rosy. On closer inspection, full time jobs were lost, part time jobs were gained and more people seem to be taking on 2nd and 3rd jobs to meet ends meet. A big NFP number is only as strong as the quality of the data.
This may explain why earnings (month on month) were down, but nonetheless, GOLD has surged on this data release as it appears market participants are starting to see the cracks in he US economy.
I am expecting a retracement to either:
1) The RED BOX ZONE: This coincides with the 0.5 FIB of the recent daily wave down.
OR
2) The EXTENDED GOLDEN ZONE: This coincides the zone between the 0.618 and 0.71 FIB levels. This would also serve as a retest of the daily "M" pattern that was formed. While the pattern became over extended in recent days, it is still possible for the neckline to be revisited.
In terms of order execution, you can:
1) Wait for a retest of the GOLDEN ZONE of the 06/10 Daily candle.
2) Place a BREAKOUT LONG above the current PURPLE ZONE, with a SL below either the midpoint of the zone OR below the zone (providing you adjust your lot size accordingly)
3) Enter call positions around this area as it will be relatively low risk.
Please remember, this is not financial advice and is purely my personal opinion.
GCM2017 trade ideas

Gold futures eyes $2,577 in acceleration of upside impulseA pullback in yellow wave (2) almost hit 61.8% of yellow wave (1).
Now we see the strong minor impulse to the upside.
It can be a part of large yellow wave (3).
The target is projected at the distance of 1.618x of wave (1) with aim at $2,577.
Watch how price breaks above the top of wave (1) beyond $2,086
Risk/reward is 1:2.5, one could get it better if goes on a lower time frame and buys on
minor pullback following minor wave 1 of (3).
Do you see gold futures touching $2,577?

Gold current scenarioCurrently good is overly boomed by geopolitical tension arise, views looks it might release some air before going up again. Let's see.
Gold medals ght go below 58300,to tgt 58900-59600-59300.
Upside above 58300 we might see jump here.

Technical and digital analysisWe notice that we are in a correction to the upside, and there is an increase in the buying momentum, and we wait for the selling momentum to weaken in the correction, and we buy

Is the Downtrend Nearing its End?Last Friday, on October 13th, a significant white candle with exceptionally high volume was observed, possibly driven by two catalysts:
– Escalating geopolitical conflicts.
– A decrease in CPI, leading to market expectations of a potential halt in rate increases by the Fed.
Trend
– A large white candle with exceptionally high volume touched the upper boundary of the downtrend channel.
– Let's observe if the market can sustain its bullish momentum next week and breach the downtrend channel.
Symmetrical Projection: Breaking the Downtrend “N” Pattern
– The 100% price projection from the initial swing starting at the 2nd lower high has been achieved.
– Furthermore, the price has already surpassed the 100% projection of the pullback, indicating the possible termination of the downtrend pattern.
– After this breach, we can expect either a reversal in the trend or a sideways movement.
Conclusion
– An uptrend is more likely to occur based on the two situations mentioned just now:
A large bullish candle with exceptionally high volume is on the verge of breaking the downtrend channel.
The downtrend N pattern has been disrupted.
Preparation for the Possible Uptrend Scenario
– Instead of simply jumping into the breakout, I will be waiting for a retest before getting on board.
– Potential retest levels: Some key Fibonacci retracement levels from the lowest low (A) to the previous high (B) (assuming the previous high is the initial target price of the upward move).
The 0.236 level: close to the key level at 1969.
The 0.382 level: close to the high of the second pullback of the downtrend.
The 0.5 level
Not Financial Advice
The information contained in this article is not intended as, and should not be understood as financial advice. You should take independent financial advice from a professional who is aware of the facts and circumstances of your individual situation.

5 Steps:The Secret Of Gold#1-Teach Yourself Gold COMEX:GC1! Trading In Technical Analysis
This is the one time gold is performing better than bitcoin.
#2-Stop Trading And Start Watching Gold
Gold has gapped a powerful 3% - as you can see in the chart above.
#3-Sick And Tired Of Losing Trades?
Losing trades can be discouraging but if you consider trading gold then you will be okay.
#4-Need More Profit?
This gold trade is more likely to give you profit this coming week.
#5-If You Can Trade You Can Buy Gold
Ideally the best time to buy gold is when no one is expecting it to rise.This gap is a powerful signal for you and me to follow.
Disclaimer:This is not financial advice do your own research before you trade
Rocket boost this content to learn more

GC1! Gold Futures Short setup I present to you a possible scenario going into the weeks ahead .
Gold finished Friday 13 Oct very strong with a move that no doubt destroyed many whom were taken by surprise with the aggressive move out of 1880 back up to 1945 in one trading session .
The question is what's next? Well no one has the exact answer but here is a possible scenario which could be on the cards . I would not be surprised to see a small pull back and all the shorts to pile in trying to sell the top before getting trapped/destroyed with another move up towards $1970 taking out the sept 20 high/liquidity before a much bigger move to the downside.
To give my chart the uncongested cleanest look , I have removed some of the levels inside of the Fib Channel to make it easier on the eye .
Above we have a High volume Node+ Liquidity and the golden pocket + Fib Channel as confluences .
I will be expecting a reaction at this region and will act accordingly .
More data will be required to determine if this is to be another LH on the HTF or a deep RT and continuation to the upside .
Set alerts at the given region and manage your SL in accordance with your trading plan and appetite for risk.
Like and follow for more setups like this and check out my previous analysis on Gold

GC XAU Weekly Analysis - Want the Bull Party to Continue
⌚️WAIT & SEE MODE / SLIGHTLY BULLISH BIAS ⌚️
🟢Super Strong Bullish Momentum Currently
🟢Geopolitical Situation is Bullish
🟢Currently in Weekly Bearish Order Block, Watching for H4 Bearish PA
🟢Ideally, want to See 1968.9 Highs Taken

Metals Setup Apex "V" (PANIC) Bottom - Rally Will ContinueGold and Silver are setting up a nearly perfect deep "V" bottom after a bout of PANIC selling over the past few weeks. This sets up a move for Gold to rally above $2250 and Silver to rally above $28.50.
Ultimately, I believe Gold will exit the Setup Phase and peak in the next phase, the Breakaway Phase, above $2450. Silver will follow with a rally to levels above $31 as it moves away from the Setup Phase and peaks in the Breakaway Phase.
These are big moves for Gold and Silver - 15% to 25% or more.
This also sends a clear message to the general/global markets that traders are hedging the uncertainties of the conflicts and the central bank/global economy credit issues. I see the next 14 months, before the US POTUS elections (Nov 2024) and possibly a few months beyond, as very concerning for the US/Global markets.
Where will the economic growth come from to drive expansion? China is contracting. Asia is contracting. Europe is contracting. The US is still operating reasonably well, considering much higher interest rates. Canada is still holding up okay, considering an extremely over-inflated asset bubble.
How long before something breaks if the US Fed decides enough is enough and moves to PAUSE rate hikes?
I guess we won't see a pause in the US Fed until possibly May/June 2024. And that will drive a fear/hedging/panic cycle where USD assets and precious metals become an effective hedge against risks.
Pay attention. This next move in metals should be very explosive.

GOLD LIVE CHARTS gold price natural and price trend in range so please follow points mark on chart and trade accordingly as per chart .

An opportunity to make some money from goldWhen the market price reaches the place where the deal was taken, you can take a buy position
We set the stop loss at 40 ticks and take profit at 120 ticks with RR1/3
Do not risk more than 1 percent of your money on this deal

Bad times to be a GOLD bullAlready yesterday we pointed out that the recent rise in the gold price was accompanied by weak volume.
Today, the market has shown clear signs of weakness for the first time in a week.
The CumDelta in gold futures reveals a massive hidden bearish divergence.
The strength of the signal suggests that the market will not only retarget the early October 2023 lows, but also undershoot them.

Market reviewOctober 12th 8:14 am eastern. We started at Bitcoin which is resting on a 382 retracement but it is trading in a very narrow range. The ES is a little more complicated and it is coming to a measured move higher... and even if it goes higher I still think the larger pattern suggests that it will reverse and if it does that it could go considerably lower. The key point for Spending time on the ES focuses on how you could have stayed in this trade if you were willing to look at the 4-Hour chart as well as looking at two bar reversals... and you would not really be on the wrong side of the market if you did this... as it was grinding higher. Gold is grinding higher.... it is in a V formation and it looks like it might retest the area where it gapped lower. Grinding markets can be bullish but they're not easy to trade because they don't have structure and retest that you might see in trending markets that are not grinding markets.

Gold shortLooking for price to run lower and stop sellers out to give a clear long entry before the draw on liquidity!

GOLD to 1845$ After reaching to 1885$ as we said, gold is going to reflect his movement to down.
Next target is 1845$ level.
Follow to get next signals

From the Gold Rush to the 10% Golden Crash next?A few weeks ago, I mentioned that the gold rally had come to an end.
At the time, the price was at $1,970, and I expected the price to crash for the rest of the year.
Well, the crash came much sooner than even I expected.
Just last week, gold prices sank another 4%. And to put this into perspective.
We have not seen this kind of gold crash performance since June 2021.
In fact, on 25 September, the gold price dropped from $1,970 per ounce down to a low of $1,829.
If you missed the first down leg of gold, you’re not going to want to miss the next one.
Here’s why I expect the price to continue down.
Why the JOLTS report is great for America but bad for gold
Let’s start with what the JOLTS report is.
The Job Openings and Labor Turnover Survey (JOLTS) report is a monthly
publication by the U.S. Bureau of Labor Statistics (BLS).
It tells us important information about the U.S. labour market.
The report is typically released a few weeks after the closely watched m (Nonfarm Payrolls) and offers a different perspective on the job market.
August data of the US JOLTS Jobs Openings was recently released. And it crushed analysts’ expectations.
It showed the job openings improved to 9.61 million in August from the previous reading of 8.92 million.
When the report came out, the gold price dropped even further.
We need to remember….
The JOLTS report of 9.61 million in August suggests a strong labour market and a boost in economic optimism.
In a growing economy, we’ll see investors will look to riskier assets like stocks over safe-haven assets like gold.
And so, this led to a decrease in gold demand and a drop in its price.
Another interest rate hike is on the cards
Several Fed officials have suggested that America can expect at least one more 25 basis points rate hike by the end of the year.
This will be to try to bring inflation back to the 2% target.
Also, with the higher jobs openings and a stronger economy – this has put the US wage inflation and higher interest rates back on the agenda.
Here is what Jim Wyckoff, senior analyst at Kitco Metals, said in a Reuters note.
“There is a reckoning that interest rates are going to be higher for much longer, which has been the bearish element in the precious market.
Gold prices could go below $1,800 in the near-term,”
I don’t normally agree with the news and hype.
But the charts agree with the downside to come.
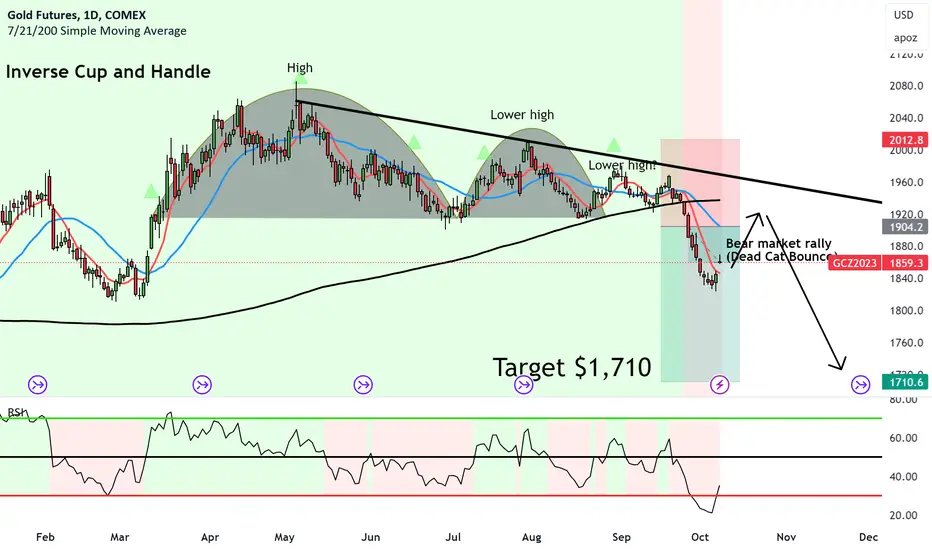
Why this massive inverse Cup and Handle is showing 10% for gold
You can see since April 2023, it’s been moving in a bearish (down) pattern known as an Inverse Cup and Handle.
Three parts make this Inverse C&H pattern including a.
Cup (big rounding top),
Handle (small rounding top) and a
Brim level (horizontal support).
Now that the price has broken below the brim level, means we should expect the price to continue down.
The first target I have for gold is to the next strong support (floor level) at $1,710.
This was the level that was tested in January, and it looks like the price will go back to that testing level again.

#Gold #XAUUSD Playing The Potential Gap PullbackIn this update we review the recent price action in the Gold futures contract and identify the next high probability trading opportunity and price objectives to target
PAST PERFORMANCE NOT INDICATIVE OF FUTURE RESULTS

War news pushes gold up 1%war new pushed gold futures up 1% pre market, vix was up almost 10% at one point
we retraced down to the .50 fib level, which was 1836. Now, going back up we can test the 1882 .618 fib level.
This war has been going on for decades and was temporary to the markets, as spy has almost fully recovered now.
The ongoing conflict in middle east should keep gold, oil and nat gas in bullish trend.
There are FOMC speakers this week as well, which will affect interest rates and DXY.
Cheers!

5 Steps:An Open Letter To Gold Investors#1-Confessiions Of A Gold Trader
Gold is a precious metal valued all around the world today , in the past and in the future.
#2-Discover The Amazing Secret To Gold
Secret to gold is to always buy it at a discounted price.
#3-Do You Honestly Want Gold?
You want to have gold in your portfolio to protect you against the inflation that is created by your local central bankers.
#4-Do You Make These Mistakes In Gold Trading?
The biggest mistake in buying gold is thinking it will crash and so you decide to use marginal trading to profit from it. This is okay unless you know what you are doing.
#5-The Secret Of Gold
Gold is has a future yield curve going to up as far as 2027 /If you scroll down to your left panel of the COMEX:GC1! futures contract you will see the future yield curve and this should give you confidence to buy it.
Disclaimer:This is not financial advice do your own research before you trade
Rocket boost this content to learn more

Dead Cat Bounce with Gold before the next crash to $1,710Bear market rally is forming with Gold.
We are seeing a somewhat recovery. But the overall medium term trend is down. And we need to act accordingly to the major trends.
This is a normal Dead Cat Bounce. And the ONLY way it will prove me wrong, is if it breaks out of the downtrend which will start a new uptrend.
So what could cause this uptrend?
1. Safe haven status becomes strong with gold again.
2. Israel and Palestine war over commercialises the public and people start taking their money out of stocks and risky assets and into Gold.
3. World stock markets crash and people can't help but invest in gold...
But right now, the trend is DOWN. So we'll stick with this trend and look for shorts only.
GOLD - LongGood luck to everyone! This analysis is for educational purposes only and does not constitute financial advice. Conduct your own analysis before making trading decisions.

Gold To 1885$ Next Week !!!Gold is going green next week to 1885$ level this week.
Watch the picture which describes possible price movement for next week.
Good luck

GOLD (GC1!) Mid Term Update - ObservationsAs mentioned in my prior weekly analysis, there were some key fib levels to look out for.
The 0.382 was hit yesterday. We waited to see how price reacted, and it broke through.
Today the 0.5 was hit. Now we will wait for the daily close and see how the price reacts for a second time.
it is highly likely a short entry will present itself either tomorrow - in regards to the upcoming ADP data - OR on Friday when NFP hits.
