Buy June gold at 2411 limit, stop at 2376, tgt openBuy June gold at 2411 limit, stop at 2376, tgt open
MGCG2025 trade ideas

GC1!_Short-Term TrendGold could get one more poke into the green box extension area noted on the chart, but as price continuously tries to confuse us, I actually think a c wave subdivision of the Minuette (v) Ending Diagonal is likely and warranted, here. I have zoomed out to show some fib confluence at the top end, some of which is already set, and some of which is speculative. I believe these waves, though, are the parameters of the completion of Minor wave C of Intermediate (5).

Short term Gold outlook Bodies respecting C.E of H1 FVG away from H4 FVG. expecting downwards momentum in New York Session

Gold Long Term Outlook Predicting Bearish Dollar Index, So believing in the strength of gold, Watching for SMT with silver to confirm longs from the Monthly FVG

Gold reacting to resistance line $2400 before Distribution phaseThe chart suggests a strong uptrend in gold prices with potential resistance around 2454.2 USD. Monitoring how the price behaves at this resistance will be crucial for future predictions. A break above could signal further bullish movement, while a reversal could indicate a pullback to lower support levels.
Bullish Scenario: If the price breaks above the high resistance level of 2454.2 USD, it could indicate a continuation of the uptrend, potentially reaching higher levels within or above the channel.
Bearish Scenario: If the price fails to break above the resistance and reverses, it may pull back to the nearest support level around 2174.6 USD or even lower to 2073.9 - 2011.7 USD.

GC / Gold / XAUUSD 4hr narrative for 17-Jun
- Price has retraced from ATH back to the origin of the move.
- 2nd tap sent the price up on 13-14 Jun.
- Some retracement expected back to the imbalance 2332 before it goes higher with perhaps the next strong rejection at the imbalance 2368.

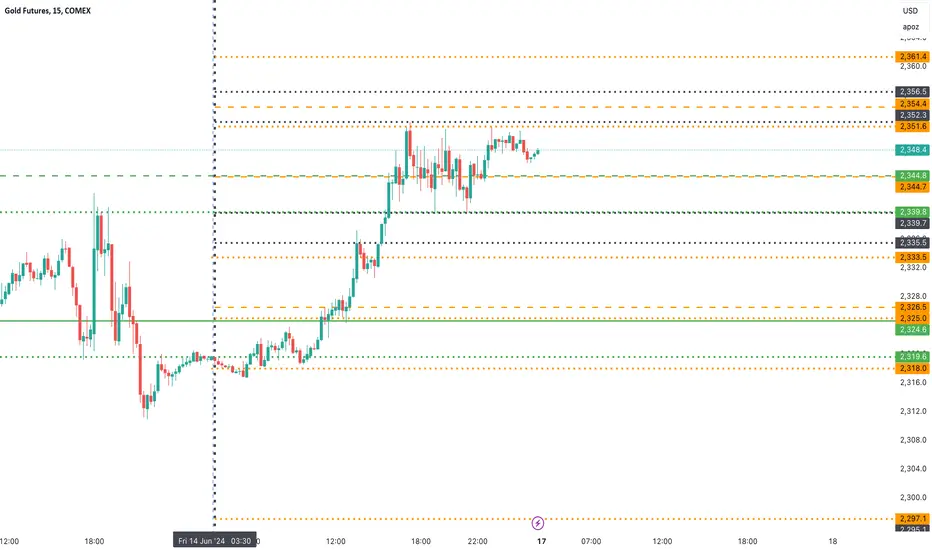
Gold COMEX Future - Intraday Levels - 17th June 2024if Sustain above 2351.6 or 2352.3 then 2354.4 then 2356.5 or 2361.4 above this bullish then 2372.6 then 2379.6 then 2396.9 to then 2412 to 2413.7 or 2417.1 to 2417.9 above this more bullish
if Sustain Below 2344.7 then 2339.7 to 2335.5 or 2333.5 below this bearish then 2326.5 to 2324.6 then 2319.6 to 2318 below this more bearish then 2297.1 to 2295.1 then 2290.9 to 2290.1
Consider some buffer points in above levels.
Please do your due diligence before trading or investment.
**Disclaimer -
I am not a registered analyst or advisor. I does not represent or endorse the accuracy or reliability of any information, conversation, or content. Stock trading is inherently risky and the users agree to assume complete and full responsibility for the outcomes of all trading decisions that they make, including but not limited to loss of capital. None of these communications should be construed as an offer to buy or sell securities, nor advice to do so. The users understands and acknowledges that there is a very high risk involved in trading securities. By using this information, the user agrees that use of this information is entirely at their own risk.
Thank you.
back testing king aaronfilled the liquidity, with a bullish to the upside. broke and retested the trendline and proceeded to the upside and the consolidation came afterwards

Can the HOUSE CAPITALIZE LONG above 4Hr Swing EQ Level...?COMEX:GC1!
"I hated every minute of Training, But I said, 'DONT QUIT'! Suffer now and live the rest of your life as a CHAMPION." -Muhammad ALI
This is a simple TXT-Book break N re-test PLAY LONG above 4Hr Swing EQ and targeting the next Minor S&R Level ($2376.0)....
I want to see price break the 1Hr Supply Zone and above the 4Hr Swing EQ Level ($2355.0). I want to see 30m Candle closures above EQ/1Hr Supply & above the Liquidity Trendline, to clarify strong conviction from buyers to go LONG!!!
Remember when it comes to FRM (Financial Risk Management) our job is to manage the downside costs of printing High side returns of $$$ consistently... Let's Step!!
Stay Focused & Reach Excellence!!
#BHM500K #NewERA #Champions

Crossover strategy for shortsThis is my goto setup for short or long. This just happens to have set up for gold short starting next week. 4 prerequisites: short moving average crosses below long moving average, price falls and then recovers to touch the slower moving average, price closes below the body of the previous candle, then hopefully prices pulls back again to allow one to get a better price for shorts. All prerequisites have been met, so I am looking for traction to the short side on gold for Monday at least, possibly persisting into midweek.

GOLD 2-week ProjectionGold sitting at major support level inside a trading range on the daily chart but where will it go from here in the next few days? Price currently trading inside a downward channel/wedge. Will we get some momentum to push higher? The beginnings of a possible butterfly pattern starting to form indicating a bullish move up to the top of the trendline with a chance to fake out long and continue down to a key fib level before breaking out again or continuing its price action inside the wedge.

I'm back.XAUUSD has risen beyond the expectations of many, it has stayed strong and the trend has not changed. Let me predict every turn it takes and follow my channel again.

GOLD SPOT UPDATE AHEAD FED POLICY EDU PUR.gold spot stya abv 2330 looks 2340-45$ where support 2325 if blw thna again dwn side mark will start till 2300+++++ in mcx 71900 abv looks 772200-300 possible

Gold Futures Technical Analysis - 15M Chart
Hey traders, here’s the scoop on Gold Futures:
The price is currently trading around $2,329.5, just below the 21 EMA (yellow line at $2,332.7), indicating potential bearish momentum on this timeframe.
There’s a recent downward movement with the price testing the trendline support.
Entry Strategy:
Short Position: Look for a pullback to the 21 EMA ($2,332.7) and ensure a strong bearish candle closes below this level. That’s your potential entry point confirming bearish momentum.
Long Position: If the price holds above $2,329.3 and breaks above the 21 EMA, look for a strong bullish candle as confirmation for a potential long entry.
🎯 Profit Targets:
Short Targets:
Target 1: $2,329.3
Target 2: $2,311.8
Long Targets:
Target 1: $2,345.1
Stop-Loss:
For shorts, set your stop-loss just above $2,332.7.
For longs, set your stop-loss just below $2,329.3.

Gold: One Last ClimbWe expect the gold price to rise once again. We expect the high of the turquoise-colored wave B to occur in our same-colored Target Zone (between $2510 and $2631). After that, the price should sell off significantly. If, on the other hand, there is an early fall below the support at $2285 (45% likely), we will see the price already in the descent now.

Can Gold Futures Hold Support?Technical Momentum Weakens
Gold Futures hit an all-time high on May 20th, 2024, at $2,454; since then, they have corrected and consolidated. From a long-term perspective, futures give us a mixed signal, recently dropping below the 50-DMA at $2,373 but remaining well above the 200-DMA at $2,153. The technical perspective shows momentum studies decreasing, with stochastics correcting back into oversold territory and DMI—just above DMI+. Short-term traders continue to monitor the 9-day moving average, trading below the 18-day moving average. At the same time, the Average True Range sits at $37/day.
Tailwinds Continue to Develop
With an 8% chance of a July rate cut, according to the CME FedWatch Tool, traders are focused on September; swaps are pricing in a 54% chance that the Fed will make its first interest rate hike in the cycle.
Geopolitical tensions, rampant fiscal spending, and central bank buying have been the main drivers and have significantly propelled Gold prices in 2024.
Industrial Metals Strengthen
The performance in the Precious Metals space remains robust and has continued to spill into the industrial complex, a testament to the strength of this sector. Traders continue to monitor manufacturing, Chinese Economic data, and the U.S. economy, which have recently driven copper futures back over $4.50/pound and Silver over $29.50/oz.
www.tradingview.com
CME Real-time Market Data help identify trading set-ups and express my market views. If you have futures in your trading portfolio, you can check out on CME Group data plans available that suit your trading needs
Disclaimers
*Trade ideas cited above are for illustration only, as an integral part of a case study to demonstrate the fundamental concepts in risk management under the market scenarios being discussed. They shall not be construed as investment recommendations or advice. Nor are they used to promote any specific products, or services.
Futures trading involves substantial risk of loss and may not be suitable for all investors. Trading advice is based on information taken from trade and statistical services and other sources Blue Line Futures, LLC believes are reliable. We do not guarantee that such information is accurate or complete and it should not be relied upon as such. Trading advice reflects our good faith judgment at a specific time and is subject to change without notice. There is no guarantee that the advice we give will result in profitable trades. All trading decisions will be made by the account holder. Past performance is not necessarily indicative of future results.

GOLD reversal patternPossible head and shoulder pattern. Not in a trade yet as I will look at lower timeframes to time my entry and get a more feasible RRR. However in trading I consider all possible setups the price can make and if the pattern don't play out as classic technical analysis I will look at the Symmetrical triangle and trade it as an alternative.

Gold Finishing Wave C of either a Flat or Triangle
Gold appears to be finishing wave C of either a flat or a triangle, although it's too early to say which one with any degree of confidence. If prices form a flat, gold should roughly follow the blue line. If they form a triangle, it should roughly follow the yellow line, creating another set of waves up and down before the next climb.

6/9 | $GCNot much for me to do since the last update on Gold. From the initial breakout, we anticipated a new high would be created before a pullback to retest demand. Now that we are back lower, I would like to see gold start to form a base for a move back to highs potentially. Watching $2300.

It's a good time to accumulate!In recent sessions, gold, which has always appreciated during periods of falling interest rates, would seem to tell us that an increase of fed funds is more plausible than a decrease. This movement is likely due to better-than-expected US employment data. We cannot predict when and if rates will be cut but I think it is a good time to accumulate shares of Gold ETCs for a good profit margin when, sooner or later, rates are cut! Stay tuned

S Aug gold at 2333.3 on stop, if filled target 2307.6, stop 2376
Gold rally looks tired and a correction, maybe short term is possible. Sell Aug gold at 2333.3 on stop, if filled target is 2307.6, stop is 2376.6

GC1: Buy ideaBuy idea on GC1 as you see on the chart because we have a spring effect on vwap and also we have the breakout with force the resistance line.
