YESTERDAY HIGH YESTER LOW SETUPADDING MORE INTO my playboook setup, looking for yesterday high or low , using ordef low to confirm my entry take tp at the next quarter point level
MGCQ2022 trade ideas

Gold: Do not slacken! 🥱Gold could not yet gain significantly more upward momentum. Therefore, we still consider it 40% likely that the precious metal will drop directly below the support at $2285, thus confirming an already established high of the turquoise wave alt.B. In this case, our turquoise Target Zone would not be reached anymore. Primarily, however, we stick to our expectation that Gold will rise into our turquoise Zone between $2510 and $2631 to place the top of the regular wave B there.

Gold shining on the "UPSIDE"Gold has been trending strongly on the higher time frames and seems like it still has a lot of room to move to the upside. We will wait patiently for the pullback on the 4hour chart demand zone that has been created. We should expect to see another leg to the upside on Gold.

Is The Next Upside Target For Gold $2500/oz?Technical Momentum Strengthens
Gold Futures hit an all-time high in 2024 at $2,454 on the June futures contract on May 20th. Since then, futures have corrected; however, gold remains firmly above the rising 50-day moving average at $2,332 and well above the 200-day moving average at $2111. The technical perspective shows momentum studies increasing, with the 9-day moving average trading above the 18-day.
Stochastics are rising from oversold territory, and DMI + above DMI- , indicating that the bulls are technically in control.
Tailwinds Continue to Develop
With a 0% chance of a June rate cut, according to the CME FedWatch Tool, traders are focused on September; swaps are pricing in a 58% chance that the Fed will make its first interest rate hike in the cycle.
Geopolitical tensions, rampant fiscal spending, and central bank buying have been the main drivers and have significantly propelled Gold prices recently.
Industrial Metals Strengthen
Performance remains strong in the Precious Metals space and has continued to spill into the industrial complex. Traders continue to monitor manufacturing, Chinese Economic data, and the U.S. economy, which have recently driven copper futures back over $5.00/pound and Silver over $32.00/oz.
www.tradingview.com
CME Real-time Market Data help identify trading set-ups and express my market views. If you have futures in your trading portfolio, you can check out on CME Group data plans available that suit your trading needs
Disclaimers
*Trade ideas cited above are for illustration only, as an integral part of a case study to demonstrate the fundamental concepts in risk management under the market scenarios being discussed. They shall not be construed as investment recommendations or advice. Nor are they used to promote any specific products, or services.
Futures trading involves substantial risk of loss and may not be suitable for all investors. Trading advice is based on information taken from trade and statistical services and other sources Blue Line Futures, LLC believes are reliable. We do not guarantee that such information is accurate or complete and it should not be relied upon as such. Trading advice reflects our good faith judgment at a specific time and is subject to change without notice. There is no guarantee that the advice we give will result in profitable trades. All trading decisions will be made by the account holder. Past performance is not necessarily indicative of future results.

Sell goldSell gold as described in the analysis provided and follow the steps specified in Stop Loss and Take Profit

New Strat ?so long story short iwent for this same looking trade yesterday on a new propfirm that i had recently just paid for and well in one trade i blew the account. and i was dumbfounded becuase i knew my analisy was right and turns out it was but heres what i got wrong.
i ended up being impatinet and not sticking to my orginal sell order and felt like i was going to miss out on this amazing opertunity and decidcied to throw out to sell limit order and go ahead and scale out the right leverage and get into the trade live in the market.
so i did that and used the proper leverage that i like and that could pass my account in the very same day and well what do you know +_+ it drops to about 500$ in profit then retraces back up then it did it again and then it traced up to 1000- and then went into 800$ Profit and then retraced agian then went all the way to my stoploss which btw was were i had preveiskiky had my sell order and well i got stoped out and breached my account. and i spent 117$ on the account through myfunded and well then guess what it drop not shi of esacly that point and went all the way to my TP BRUH. and so i took another trade today and relizsed the same set up and im now wanting to understand this set up becuase it has work 2 times esacly the same way within the marketn

GOLD (GCM2024, XAUUSD)... BULLISH BIAS!Bias is Bullish.
Price is moving up with convincing
momentum. Respecting bullish PD
Arrays, disrespecting bearish ones.
No signs of reversal. The intent to
reach the DOL/Swing High seems
clear.
The expectation is for Gold to make
further gains. A potential pullback
to 2400 area would make sense as a
zone to buy from, as buying from the
top is not recommended.
Thank you for viewing!
Leave any questions or comments in the comment section.
I appreciate any feedback from my viewers!
Like and/or subscribe if you want more accurate analysis.
Thank you so much!
May profits be upon you.

a weekly price action market recap and outlook - goldGood Morning and I hope you are well.
This is my weekly outlook, written yesterday evening. So market already made the new ath and now I wait to see if they want to squeeze higher or we hit a hard wall for big players to continue to unload.
gold futures
Quote from last week:
bull case: 2285 was the low last Friday and this week held above it and my two legged correction was almost perfect to the tick for the A and the B leg and C was only short 20 points. So I gave you perfect 50 points up, 20 points down and another 50 points up. Hope you made some. Bulls are in clear control and until bears break strongly below 2300 again, we are on our way to retest 2448.
comment: 3 clear pushes up and still not near 2450, which is not as bullish as it could be but it’s still only going up so naturally I look for longs. Market probably will not stop until we print 2445 or 2450 but the recent pull-backs went on long and deep enough for me to think the upside is probably limited.
current market cycle: trading range
key levels: 2290 - 2450
bull case: Bulls continue inside the wedge and buy every dip they get. 2450 obvious magnet above. I won’t make this longer than it has to be. Weekly and monthly charts also just give bullish signals for this. This month is still an inside bar on the monthly chart, so if bears keep this as a lower high, odds favor trading back down to around 2320
bear case: All highs in this bull wedge were sold and we already had 3 clear pushes up. Bears will probably get a pull-back on Monday and then market has to decide if it want’s another try at 2450 or higher. First bear target is a retest of the breakout 2400 and then the 4h 20ema around 2390.
outlook last week: “Neutral until clear break of the given range. —unchanged”
→ Last Sunday we traded 2375 and now we are at 2417. No opinion last week.
short term: Small pull-back before another test of 2348 or higher. Invalid below 2370.
medium-long term: Still no better opinion on this to be honest. I don’t like to get into the speculations why the Gold price is where it is. I have been saying that the market was very unusual over the last 2 months to say the least. We are on our way to retest the highs and after that I expect to trade down to at least 2150 but for that we need way bigger selling pressure. —unchanged
Chart update: Removed bear flag. Added bull wedge.

GoldThis not a trading signal, this is just my opinion and if you copy my trade the risk is on you.
Gold on the daily chart , is @ resistance retesting the previous highs before pulling back to the support levels around $2,353 therefore im entering 2 trades ( one Selling to the support level, and other is ( Buying to continue with the up trend aiming for newer high.

5/12 | $GCWas expecting a dip, however we ripped out of the bull flag. New path of interest will be taking new highs before a buyable dip. That's where I will be interested in playing again.

Can the HOUSE CAPITALIZE SHORT after 4Hr Supply Mitigation...?COMEX:GC1!
“Persistence can change failure into extraordinary achievement.” -Matt Biondi
I believe that we are going to be able to catch a nice HIGH PROBABLE SHORT here on GOLD very soon...Being that price is currently trading inside of this Daily Supply and even clearer the Mitigated 4Hr SUPPLY ZONE!! I'm going to wait patiently for PA to continue to develop and then we'll drop down to a LTF and wait for a confirmed 15m CHoCh and then we may enter the market SHORT... I will keep update once we get more data printed...
Remember when it comes to FRM (Financial Risk Management) our job is to manage the downside costs of printing High side returns of $$$ consistently... Let's Step!!
Stay Focused & Reach Excellence!!
#BHM500K #NewERA #Champions

Golden, Green, or ScarletHey There, Welcome Back. Today we analyze the evergreen hedge commodity.
- If you are an Indian, Given that Gold rallied almost 17% in a very short span You must be quite happy. We Indians love gold. Especially, the ladies in our homes.
- The chart of Gold Futures is showing something interesting. The price took quite a rejection from the recent support zone.
- If this rejection holds, we may see a correction/retracement.
- On the other hand, we may just see a consolidation phase (Which is usual after a good rally)
- Only future price action will tell what's what but in the meantime, here are a few rumors/updates to know in the vicinity of Gold (Some are just rumors so take it with a pinch of salt) :
- BRICS Bloc is rumored to introduce a gold-backed currency that will any day be more reliable than the flat currency every other country has.
- US is battling Economy slowdown and recession. The United States has the world's highest national debt with $30.1 trillion owed to creditors as of the first quarter of 2023- Al Jazeera.
- The US Credit ratings were reduced to AA+ from the elite AAA
- If the BRICS Currency comes out, 85% of the global population will stop using US Dollars for intra trades settlement (BRICS Nations)
- Russia is out of the SWIFT System meaning USD Dealings are off the table. That reduces the demand for dollars.
- Saudi Arabia is rumored to join BRICS. Also, for the first time, they are considering accepting other currencies besides the Dollar for Oil trades. This may hugely impact the almighty dollar.
- In the calendar year 2022, central banks around the world purchased a record 1,136 tonnes of gold.
- RBI’s hoard of gold is now almost 800 tonnes
- China’s Central Bank is accumulating gold for straight 9 months
- Gold may soon be the King once again.
Does that mean we will start buying gold at any given price? Absolutely Not. But we will surely keep a check on the global news, the price action, and our overall asset allocations.
Have Requests, Questions, or Suggestions? DM us or comment below.👇
⚠️Disclaimer: We are not registered advisors. The views expressed here are merely personal opinions. Irrespective of the language used, Nothing mentioned here should be considered as advice or recommendation. Please consult with your financial advisors before making any investment decisions. Like everybody else, we too can be wrong at times ✌🏻

58% win rate Python trend follow trade set upThis trade set up call SNRC that use previous resistance as support when price break above and comeback to retest
I backtesting this trade set up with Python using 720 day price history data
so you can see the optimization heat map
this is 58% win rate with 2RR trade set up

📉 Gold Futures Parabolic RiseThe black curved line on the chart is called a "parabola," as in "parabolic rise."
A parabolic rise tends to lead to a very strong correction.
The only way to sustained a parabolic rise is... Well, it is impossible, the Gold market fluctuates between up and down.
The peak, ATH, happened on the 8-April weekly session.
This session ended with a long upper shadow followed by a local lower high.
The whole chart structure has bearish potential.
I am here trying to predict a reversal, which is something very hard to do.
In order to predict a change of trend, we always have to jump in when things are not looking the best.
By the time the signals are clear and confirmed, Gold will be trading at $2,300 or below $2,250. I personally wouldn't wait for those.
➖ Some people trade the breakout with low risk;
➖ Some people trade before the breakout with a tight stop-loss and still very low risk but a higher potential for reward.
What you choose, is up to you.
My mission is to alert of the move before it comes.
After the bearish comes a bullish wave.
Thanks a lot for your continued support.
Namaste.

UPDATE GOld hit 1st target - 2nd Target ready to rally to $2,746Our gold anaslysis played out very nicely after the triangle formation, breakout and then run up to the first target at $2,236.
Now we have a new formation in the making - W FOrmation.
I do believe we will get some sideways movement to create equilibrium and prepare for the next run up.
So as long as the price is above the 20 and 200MA - it's good to go!
My second target is set for gold to $2,746

Precious metals have been just that, precious Gold SilverThe US #Dollar is trading in the middle of its range since Late 2022.
It is also holding the recent uptrend well.
TVC:VIX is a tad lower today.
#Gold & #Silver still look good, Daily & Weekly.
Loading up on AMEX:SLV when we stated the inverse head & shoulder was a good move.
(took some off recently but still have large position)
AMEX:CEF AMEX:GLD

GOLD Next movegold just gave a divergence -tight divergence on the daily tf and a wide divergence on the 4hr tf . it as well gave us a rising eadge with a break of the counter trend line and a retest on the 4hrs time frame giving us an entry

Gold, not FoldMoving averages displaying all the characteristics of an uptrend, classical Inverse H&S pattern formed, as long with volume upticks with prices pushing upwards leads me to believe this precious metal price could increase

Gold COMEX Future - Intraday Levels - 15th May 2024*ONLY MAJOR LEVEL* also refer yesterdays level
if Sustain above 2365.3 then bullish then 2375 then 2383.1 then 2395.3 to 2399.4 then 2411.8 to 2417.1 then 2420 then 2420.9 above this more bullish
if Sustain Below 2360.3 or 2358.2 below this bearish then 2346.3 then 2338.2 to 2324.1 below this more bearish
Consider some buffer points in above levels.
Please do your due diligence before trading or investment.
**Disclaimer -
I am not a SEBI registered analyst or advisor. I does not represent or endorse the accuracy or reliability of any information, conversation, or content. Stock trading is inherently risky and the users agree to assume complete and full responsibility for the outcomes of all trading decisions that they make, including but not limited to loss of capital. None of these communications should be construed as an offer to buy or sell securities, nor advice to do so. The users understands and acknowledges that there is a very high risk involved in trading securities. By using this information, the user agrees that use of this information is entirely at their own risk.
Thank you.

Gold Futures Target All-Time HighsTechnical Momentum Strengthens
Gold Futures hit an all-time high in 2024 at $2,448 on the June futures contract on April 12. Since then, futures have corrected; however, gold remains firmly above the rising 50-day moving average at $2,294 and well above the 200-day moving average at $2101. The technical perspective shows momentum studies increasing, with the 9-day moving average trading above the 18-day.
Stochastics are rising from oversold territory, and DMI + above DMI- , indicating that the bulls are technically in control.
Tailwinds Continue to Develop
With a 3% chance of a June rate cut, according to the CME FedWatch Tool, traders are focused on September; swaps are pricing in a 65% chance that the Fed will make its first interest rate hike in the cycle.
Geopolitical tensions, rampant fiscal spending, and central bank buying have been the main drivers and have significantly propelled Gold prices recently.
Industrial Metals Strengthen
Performance remains strong in the Precious Metals space and has continued to spill into the industrial complex. Traders continue to monitor manufacturing, Chinese Economic data, and the U.S. economy.
www.tradingview.com
CME Real-time Market Data help identify trading set-ups and express my market views. If you have futures in your trading portfolio, you can check out on CME Group data plans available that suit your trading needs
Disclaimers
*Trade ideas cited above are for illustration only, as an integral part of a case study to demonstrate the fundamental concepts in risk management under the market scenarios being discussed. They shall not be construed as investment recommendations or advice. Nor are they used to promote any specific products, or services.
Futures trading involves substantial risk of loss and may not be suitable for all investors. Trading advice is based on information taken from trade and statistical services and other sources Blue Line Futures, LLC believes are reliable. We do not guarantee that such information is accurate or complete and it should not be relied upon as such. Trading advice reflects our good faith judgment at a specific time and is subject to change without notice. There is no guarantee that the advice we give will result in profitable trades. All trading decisions will be made by the account holder. Past performance is not necessarily indicative of future results.

Gold Futures Target All-Time HighsTechnical Momentum Strengthens
Gold Futures hit an all-time high in 2024 at $2,448 on the June futures contract on April 12. Since then, futures have corrected; however, gold remains firmly above the rising 50-day moving average at $2,294 and well above the 200-day moving average at $2101. The technical perspective shows momentum studies increasing, with the 9-day moving average trading above the 18-day.
Stochastics are rising from oversold territory, and DMI + above DMI- , indicating that the bulls are technically in control.
Tailwinds Continue to Develop
With a 3% chance of a June rate cut, according to the CME's Fedwatch tool, traders are focused on September; swaps are pricing in a 65% chance that the Fed will make its first interest rate hike in the cycle.
Geopolitical tensions, rampant fiscal spending, and central bank buying have been the main drivers and have significantly propelled Gold prices recently.
Industrial Metals Strengthen
Performance remains strong in the Precious Metals space and has continued to spill into the industrial complex. Traders continue to monitor manufacturing, Chinese Economic data, and the U.S. economy.
www.tradingview.com
CME Real-time Market Data help identify trading set-ups and express my market views. If you have futures in your trading portfolio, you can check out on CME Group data plans available that suit your trading needs
Disclaimers
*Trade ideas cited above are for illustration only, as an integral part of a case study to demonstrate the fundamental concepts in risk management under the market scenarios being discussed. They shall not be construed as investment recommendations or advice. Nor are they used to promote any specific products, or services.
Futures trading involves substantial risk of loss and may not be suitable for all investors. Trading advice is based on information taken from trade and statistical services and other sources Blue Line Futures, LLC believes are reliable. We do not guarantee that such information is accurate or complete and it should not be relied upon as such. Trading advice reflects our good faith judgment at a specific time and is subject to change without notice. There is no guarantee that the advice we give will result in profitable trades. All trading decisions will be made by the account holder. Past performance is not necessarily indicative of future results.

GOLD Price Stability Amid Rising Global TensionsOn Tuesday, the price of gold stabilized as mounting geopolitical tensions spurred demand for the safe-haven asset.
Escalating protests against Israel’s presence in Gaza, Russia’s initiation of a new conflict in Ukraine, and concerns regarding potential disruptions in global trade have heightened the perception of geopolitical risk.
The decision by BRICS nations to reduce reliance on the US Dollar for international trade transactions has bolstered interest in gold as an alternative. Consequently, there has been a notable increase in non-Western central banks' demand for gold, accompanied by a corresponding decrease in US Dollar reserves.
Gold is being considered as a viable substitute for the US Dollar as a secure store of value in international trade agreements involving nations with volatile domestic currencies, as per insights from the Carnegie Endowment for International Peace, a Washington-based advisory service.
From a technical standpoint, analysis of the H4 timeframe reveals a divergence in the cumulative delta, with the preceding candle exhibiting a negative cumulative delta while the current candle shows a positive delta. The previous candle effectively absorbed all inefficiency orders from sellers, forming an absorption candle characterized by a long spike, while the current candle is endeavoring to elevate buyer volume. There is potential for the current candle to retest the previous candle's point of control (POC) to attract new buyers at a discounted rate. Our strategy revolves around a long setup with a target aimed at the previous fair value area.

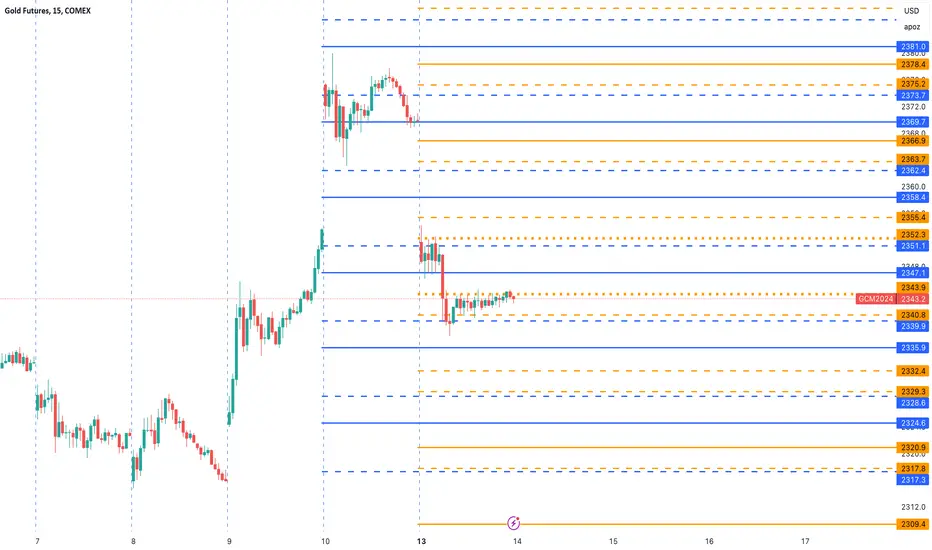
Gold COMEX Future - Intraday Levels - 14th May 2024if Sustain above 2343.9 then 2347.1 then 2351.1 to 2352.3 then 2355.4 above this bullish then 2358.4 then 2362.4 to 2363.7 then 2366.9 above this more bullish
if Sustain Below 2340.8 or 2339.9 below this bearish then 2335.9 then 2332.4 then 2329.3 to 2328.6 below this more bearish
Consider some buffer points in above levels.
Please do your due diligence before trading or investment.
**Disclaimer -
I am not a SEBI registered analyst or advisor. I does not represent or endorse the accuracy or reliability of any information, conversation, or content. Stock trading is inherently risky and the users agree to assume complete and full responsibility for the outcomes of all trading decisions that they make, including but not limited to loss of capital. None of these communications should be construed as an offer to buy or sell securities, nor advice to do so. The users understands and acknowledges that there is a very high risk involved in trading securities. By using this information, the user agrees that use of this information is entirely at their own risk.
Thank you.