dashDash is above the 200 DEMA vs ETH for the 1st time since 3/2020.
Dash has previously broke above and then Nuked quickly below.
But still something I think is worth paying attention to.

DASHETH - Long - Potential 24.5%DASHETH - Long - Potential 24.5%
Exchanges: Bittrex, Binance, KuCoin
Signal Type: Regular (Long)
Entry Zone:
0.04150 - 0.04377
Take-Profit Targets:
1) 0.04588
2) 0.04984
3) 0.05419
Stop Targets:
1) 0.03777
Entry Trigger - Heavily Oversold, on bottom support, trend break

Eyes on Dash | 1200% potential | Long | DashEthEyes on Dash Eth - the sleeping giant no-one talks about.
----------------
Weekly
-
Market Cap Eth 1,185,373
24 Hour Trading Vol Eth 571,779
-
Green = Resistance
Red = Support
-
All-Time High in #Eth was Eth 5.611519
-
PA was sent down from 20 ema.
The right time to accumulate.
Landing on Moon in O

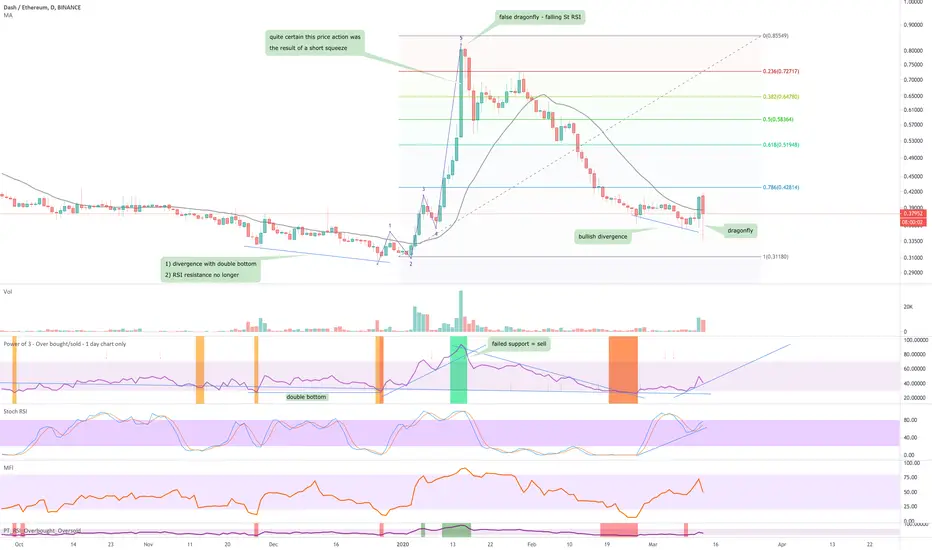
Dash / EthereumFollowing a 90% correction and oversold condition (orange column) an ‘incredible buy’ opportunity now exists. The Bollinger Band overlay is included on the above 1-day chart to illustrate how overextended price action is, 50% away from the mean (centre black line). This is ridiculous.
Whether you’r


DASH / ETH looks ready for takeoffDash is incredibly undervalued against ETH right now. TP levels shown.

DASH/ETH Massive rally aheadIf bulls succeed in breaking the and sustain above 0.22-23 level (the moving average) then the probability of the trend reversal is rising, and we can expect the big moves from DASH.

Regular Bullish Divergence on weekly. Invest 1%, SL @5% loss.Regular divergence is the classic sense of divergence that occurs when the price action makes higher highs or lower lows while the oscillating indicator does not. This indicates a weakness in the price action and anearly warning that the trend could be coming to an end. In other words, regular diver

Dash vs Ethereum1-day chart showing us bullish divergence on the Dash / Ethereum pair together with Higher Lows on the Stochastic RSI following a (as if you hadn't noticed!) a strong oversold period. In addition price action has just made a band-to-band transition to the bullish half of the Bollinger band to find s

See all ideas