DGB/BTC - WEEKLY E2EActivated E2E trade
1. Chikou Bullish
2. TK Cross Bullish
3. Entry into the cloud
Trade Setup
Entry 1: 182 - R of 6
Entry 2: 162 - R of 11.9
SL: 138
TP: 448
Expect to be patient as this is a weekly chart!
Trade, Chart, Learn, Repeat
ACG
DGBBTC trade ideas

Digibyte 4h Chart UPDATEDigiByte 4h Chart UPDATE:
1 - The prior chart still valid! I'm just detailing my vision.
2 - We can see 28 days RSI resistance (yellow line).
3 - To view a great movement, DGB need break above 60 RSI.
4 - Possibility to complete an inverted head and shoulders.
If you enjoyed this update, please leave your like!
Cheers

Bullish Flag Formation BREAK OUTDigiByte 4h Chart UPDATE:
1 - The prior chart was confirmed! Moved exactly as I predicted!
2 - DGB breakout the 9 days FLAG.
3 - Strong resistance at 185 / 220 sats
4 - TARGET: 255 sats
If you enjoyed this update, please leave your like!
Cheers!


third wavefifth red wave is canceled so i think this is third green wave and go to 220-260-290
tell me ur idea at comment
i hope all of you gain a lot of $

Bullish Flag Formation (4h chart)The prior chart still valid! I'm just improving the vision.
1 - We didn't seen any flag breakout yet.
2 - EMA 50 / 200 didn't cross (very bullish signal).
3 - Green line = 45 days uptrend.
4 - Break above the ORANGE line = BULLISH signal
5 - Break below the green line = BREARISH signal
6 - First support - red line
7 - Second and strongest support - green line
Do you like my charts? Please leave your like!
Cheers.

#DGB SECOND UPROUND BY JUNE15 ,IIIRD BY JAN 2021 & TEST 2000 SATIN DAILY CHART 21 SMA EXPECTED TO TOUCH 200 SMA DOWNWARD AT AND AROUND 150 AND 160 SAT BY 15 JUNE IT IS MARKED IN MAIN CHART BY YELLOW SQUARE AND AT DIVERGENCE CHART AS WELL BY VERTICAL LINE. THEREFROM IT WILL TAKE SECOND ROUND OF UPWARD MOVEMENT TILL IT REACHES AROUND 500 SAT AND THEREAFTER IT WILL BOOM IN JAN MID 2021 TO MOON MAY CROSS 2000 SAT ALSO.


Long DGB - cup and handlePotential cup and handle forming. Fingers crossed to see if there will be another 300-400% increase. Very strong support at 180sats. If it breaks, then going down to see 150sats to gain more support.


Bullish Flag Formation (4h chart)As I said in my preview post, "we have a possibility of bullish flag formation, if DGB breaks below 210 (under pennant), but hold above red/orange line."
Now, we have a bullish flag formation.
If candle close above 215, DGB will turn bullish.
If candle close under 185, DGB will turn bearish.
Support at 190 (EMA 200 + flag bottom).
EMA 50 / 200 didn't cross (very bullish signal).
Very strong resistance RSI at 60, DGB will need a large volume to break that level.
I hope you enjoy this update.

Digibyte 4h UpdateAs I said in my preview post, we have a strong RSI resistance at 60 level and other strong resistance at 220 sats (both were clearly marked on the chart).
If Digibyte breaks these two resistances, a big upward movement will be expected.
1 - EMA 50 / 200 didn't cross (very bullish signal)
2 - Pennant formation
2 - MACD going up
3 - RSI fighting to break the resistance (+-60)
4 - Support at 190 sats.
If Digibyte climb above 225 sats (candle closing above 225 sats), a great upward movement is expected (uptrend reversal)


Digibyte 4h Chart1 - EMA 50 / 200 didn't cross (very bullish signal)
2 - MACD going up
3 - RSI fighting to break the resistance (+-60)
3 - I believe that we can have a retest on the downtrend parallel channel (marked in green)
Support at +- 200 sats.
If Digibyte retest the parallel channel and climb above 220 sats, a great upward movement is expected (uptrend reversal)

If Wave 3 is starting...#DGB $DGBThen go get your fucking space suit!!! This is not financial advice. (don't forget to pack your punting shoes)


DigiByteDGBBTC
I don’t know how many people are in this coin, but I want to warn that the situation may continue by breaking the support line of this triangle. Be careful
I see first stop at the green box
Best regards EXCAVO


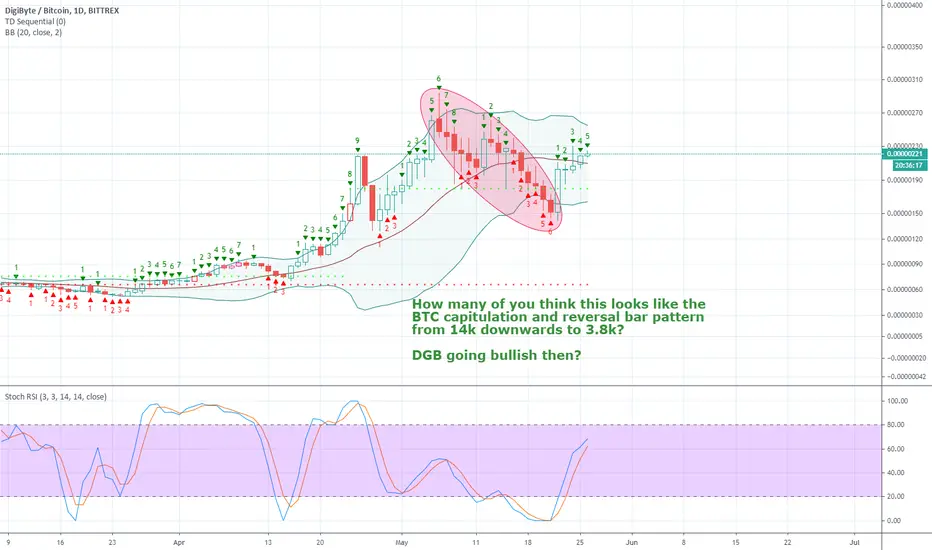
There's still hope for DigibyteFrom the week of April 17, 2017 to May 1, 2017 DGB dropped approx 48% in value (116 to 61 sat) before nearly touching the 9 MA before its historic bullrun. We are currently down approx 47% from May 5 high (294 to 154 sat) and nearly touched 9MA. If this trend is to repeat the historic 2017 run, it is expected for DGB to recover these last 4 days of the week and hopefully close the weekly candle green. Stoch RSI also shows DGB oversold on the daily chart for the first time since April 16, where it then rallied +200% in the following week.
Good luck to you all!

