DGBBTC ChartingSome levels to look at. Sitting on long time support now waiting on confirmation on which way it will go.
DGBBTC trade ideas

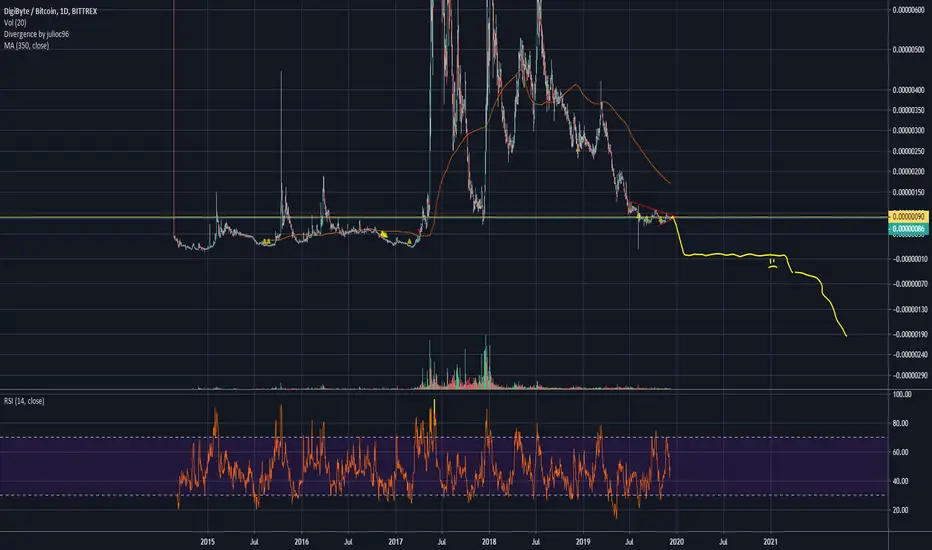
DGB-BTC to fall to -150 sats due to de-listing from PoloniexThis is not a guess (it is), it will happen exactly as this chart shows it (it won't).
De-listing of one of the oldest alt-coins in existence from Poloniex means anyone who owns this coin will be required to pay people to take their coins from them.
This is what happens when the CEO of Tron buys exchanges to centralize everything crypto.
DGBBTC Nice consolidationRoom to pump, very cheap right now. Previous bull runs have pushed the price up to ~2700 sats, I don't think we will see this type of move but there is definitely room for growth. Fractals include pump fractal and further consolidation fractal.

Digibyte Delisting, does it even matter? Welcome fellow Tradingviewers,
We have probably all seen the fued between Jared Tate and Polienex, if you haven't here is a small summary.
Polienex tweeted that their followers should all buy TRX, the tweet quickly got removed but some twitter accounts already managed to take a screenshot. Reportedly the cryptocurrency exchange would have been bought by Justin Sun and this probably was a big shilling of the TRX cryptocurrency. After Jared Tate saw the tweet, he decided to say a thing or two about Polienex, which has been one of the exchanges that supported DGB for a long time. After Polienex saw the comments made by Jared Tate and other DGB members they decided that all of the sudden Digibyte did not have the right listing standards and that DGB will be delisted in the near future.
If you want to know more about this fued, checkout Polienex or Jared Tate's twitter accounts to get more info on the matter.
We have not seen any effects in the price for now, this is also because Polienex was'nt even bringing in 1% of the trading volume, but lets see what could happen in the future!
We will be looking at the price action from Digibyte using a top down strategy where we are going to analyze down from the monthly.
Monthly :
- Looking neutral
- Candles are indecisive
- MA's are bearish
- MACD is still in bearish territory
- RSI is in Neutral
- Volume is very low
Weekly :
- Looking Bullish
- We saw a bullish engulfing candle 2 weeks agoi which led us to test the 100 sats resistance
- Ma's are Bearish
- Volume is very low
- We might be moving in a big falling wedge, which is know to be a Bullish pattern
- MACD has crossed Bullish
- RSI has just come from the oversold region
Daily :
- Looking Neutral.
- We saw a Bearish engulfing candle on yesterdays close.
- We found support on the 50 and 100 MA
- MACD just crossed Bearish.
- RSI is neutral
- Volume has picked up a bit
- Moving inside a falling wedge which is known for trendreversals
What's next?
Well depending on the next couple of weeks, a lot could happen.
The Bullish engulfing candle on the weekly tells us that we can expect more upside momentum.
The biggest challenge is breaking the upper trendline of the wedge, if we break this upper trendline with enough volume, then i will be confident that we have a good year ahead of us!
This analyses is only showing you guys my vision on DGB and should not be considered as financial advice.
If you agree or find this analyses useful, don't forget to leave a Like!
And if you disagree or have a comment , let me know below!
Kind regards,
Forallcrypto

DigiByte do you even $$$, Bro?I have a feeling this will become a monster.
DGB is historical for Alt runs, and they are at a bargain right now with increasing buy pressure as Price stabilizes at near the same level as MAR 2017 before it went full reptar!
I'm holding this one for All of 2020.


Digibyte Elliott Waves DowntrendIn this chart I am trying to visualize an Elliott Wave market cycle of DGB/BTC with 5 waves pattern, and ABC pattern forming which is getting close to finalize close to current price range levels, anytime soon we expect a trend reversal with possible new targets. Digibyte had a lot of development during the bear market 2018-2019, and stands out with great fundamentals which can have a huge impact on $DGB price. Currently Digibyte awareness is at level of Ethereum in 2014, but the development of Digibyte is far ahead and looks like it's very forward and innovative blockchain network with best technological properties.

DGBBTC Price Analysis - Choppy and extremely bearishHi all,
The DGBBTC price is extremely choppy and showing signs bearishness. But I'm confident that it will turn to hit the 0.00000135 and 0.00000215 zones in the near future.


DigiByte Breaks Its Downtrend | Manual Stop-loss Saved Us!DigiByte (DGBBTC) broke its downtrend on the weekly time frame (left) and printed a clear reversal candlestick (circled in blue).
We can expect for DigiByte to recover here and a start a new, strong and sustained uptrend... Yes, I am calling for a change of trend here.
DGBBTC hit bottom on a low wick at 15 satoshis.
If you follow "conventional" trading and had a stop-loss in place, you would get killed here and lose all of your money to this long wick.
We use what I call a "manual stop-loss" and only activate this based on the weekly candle close.
The same candlestick that hit 15 satoshis, ended up closing at 85 satoshis.
We have an active trade for DigiByte and our stop-loss is a weekly close below 82 sats... So for use we remain active, our funds are safe and we can collect profits up once the trend change.
Here you can read more about our manual stop-loss strategy:
Thanks a lot for reading.
Namaste.

Dgb finally finds it’s bottom?My first crypto coin I ever bought was $dgb.
And therefore I still like to track it.
It seems there is finally some good news for DGB holders on the chart:
- the price found support on the price levels of before the enormous price peak.
- the last correction wave pattern seems to be in it’s last part, or even has ended already.
From here there seems upward potential; with the remark that if prices DO break below the support it will be a race to get out asap.


DGB accumulation rangeDGB/ BTC pair is in the accumulation range. Currently, it is at the wave C of the ABC correction. Based on the retracement length of wave A, the wave C can go as low as 68 satoshi, and in best case scenario, support can be found around 80 satoshi.
Long bids in the area of 68-80 satoshi, with a stop loss right below
Good luck!


DGB on Bonfire indicator The downtrends in Bonfire indicators above the price should bring some bullish momentum. Pivots are marked and the goal is a a nice cross up over SN, DL and Buffer..
More on Bonfire indicator @ docs.google.com


$DGB @ a critical pointWe haven't seen these prices since December 2017 and looks like a big area of support
if broken than we are going to 0.00000023BTC, Looking at where the price in relation to the Linear Regression is it is looking likely But only if this area of support is broken.
Ill be waiting and watching for my next move on this one.

DGB (Digibyte) Leaving The Station..!!$DGB #DGB (Update)
- Forming Falling Wedge In Daily TF.
- All Indicators Turning Bullish.
- Coin With Huge Community
- $DOGE & $DGB Both Looks SIMILAR In Daily TF Charts.
- Keep Your Eyes On It..
Hit Like For Support & Motivation.
Thanks

DGBBTC a bearish shark move | Upto 780% or more profitThe price action has formed a bearish shark from X to C leg.
Now the priceline has entered in potential reversal zone and we have pivot 1st support withing this PRZ area which will push the up to hit the sell targets soon insha Allah.
Volume profile is also showing very poor interest of traders in this area.
The targets are:
Buy between: 0.00000168 to 0.00000001
Sell targets:
Secure sell targets:
Sell between: 0.00000338 to 0.00000694
Aggressive targets:
Sell between: 0.00000808 to 0.00000969

DGB/DigiByte: Heavy Classic Bullish Divergence on MACD and RSIHello fellow traders,
As you can see on the chart is DGB against BTC in a downtrend for a while now. But it looks like the tide is turning in favor for the bulls.
On the daily is DGB showing a classic bullish divergence on the RSI and MACD.
This is not a financial advise, but i see this good quality coin make a parabolic rise in the very near future.
Good luck!

