DOTUSDT - Looks Bearish on Hour timeframeKey levels are defined on the chart.
I am expecting another LL because it has already created one LH.
Their is no sign for trend reversal on short term. Expect for Short entry if it break SL.
DOTUST trade ideas

#DOTUSDT | 4 HOUR TIMEFRAME UPDATE#DOTUSDT | 4 HOUR TIMEFRAME UPDATE
We can expect that #DOTUSDT will come to the zone of $6.670 - $6.500 (the grey area that you see on the chart). At that grey area, we can look for confirmation ✅ to open a LONG position.
The target of this UPWARD movement is to reach $7.010 - $7.190 - $7.570 - $8.060
Invalidation below $6.015 ❌

DOT a False Breakout?The symetrical triangle that formed at the end of the recent downtrend was optimistically viewed by many as a potential trend reversal. Then the news of a possilbe approval for an ETH ETF after tweets by the SEC caused a breakout.
A re-test of teh symetrical triangle around $7.20 is a possible scenario, however, if after the retest price does not hold above $6.90, then the recent spike in price will prove to be a false breakout.

Trade Plan for Polkadot: Ready for Another 100% Gain?Fundamentally, GATEIO:DOTUSDT appears like a dead project, which is obvious in its price action in the last 8 to 12 months.
Dot does not look good for investors but is not bad for trading.
Again, we are ready to trade its breakout for a possible 100% profit, when the opportunity presents itself.
What do you think about Dot? Share it with me in the comment box.
If this analysis makes sense to you, follow me now for more and support my idea.
Cheers!

Alikze »» DOT | 61.8 Fibo retest scenarioAccording to the long-term analysis, the DOT currency is moving in the 1W time frame, which, as mentioned in the updated micro-waves of the previous post, completed a complete cycle in accordance with the path in the range of 11.92.
💎 First scenario: due to the recent three-wave correction and support in an important PRZ area, an upward corrective movement is currently underway, which is currently stopped at the 0.618 area. Therefore, if this X wave is not upward and after the completion of the correction log until the liquidity zone or PRZ leads to the failure of the zone and the daily candle is closed above it, it can continue the movement until the specified resistance PRZ zone. to give
💎 Second scenario: If the support PRZ area is broken, this can lead to a continuing corrective lag and a combined correction and correct the whole wave up to 0.23.
If the behavior and structure of the post changes, it will be updated.
»»»«««»»»«««»»»«««
Please support this idea with a LIKE and COMMENT if you find it useful and Click "Follow" on our profile if you'd like these trade ideas delivered straight to your email in the future.
Thanks for your continued support.
Sincerely.❤️
»»»«««»»»«««»»»«««

Polkadot: Is it time to buy?DOT is trading almost 87% lower than its previous ATH and is now about to hit its bottom support again, IMO. The $4.75 level is my buy zone for DOT, with a target of $14 for the midterm and an optimistic target of $128 for the long term in case of a super bullish market.

DOT formed a Saxaphone patternEverytime a trend forms the shape of a ladel or a saxaphone BINANCE:DOTUSDT , it usually means an imminent sell off. So if price bounces off of the symetrical tirangle, then great, it's just a retest...but if price falls below $7.20 and then again below $6.90 it will be major capitulation down to the lower $5.00 range.

DOTUSDT-Bullish FlagThe cryto pair made bullish flag pattern on 1h TF. Entry can be taken at current price with SL and TP mentioned.

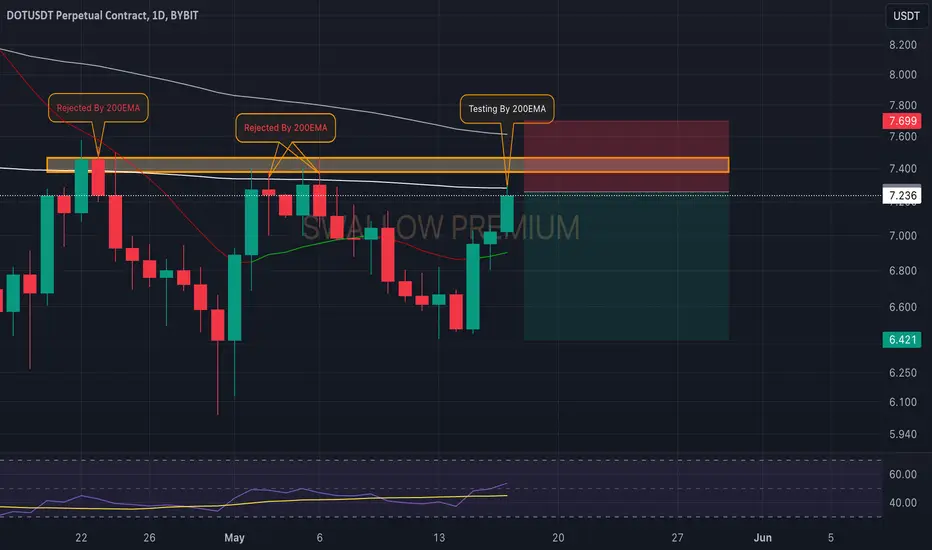
Polkadot (DOT): Keep an Eye on 200EMA !!!We are back with Polkadot, where our attention has caught that 200EMA which has been holding its ground since April 22.
We are now yet again back at 200EMA testing it, and we are looking for a potential rejection to happen from here. If we see it, we should see a nice downward movement from here!
Swallow Team
POLKADOT AMONG MY PICKS FOR ALT SEASON
This could be Polkadot for the bull run. Price might retrace to $5.6 but i highly doubt it with the presence of strong volume an relative strength index already above the previous high syncing with the price action, it is a strong indication of buyers taking charge and imminent price surge.
Again as I have emphasised on previous analysis, do not time a perfect entry just accumulate for the ALT SEASON and expext at least x3-5.
OTHER ANALYSIS

DOT Monthly Forecast for 2024 - ImageHere is my view for DOT
I think we are in a good spot to take a long

DOT - Monthly Chart - View for 2024DOT chart, i feel we are in a good spot to buy this here for a nice move up.

Buy today, and we'll see you in December 2024.I feel that today is still a good buying opportunity. There were people who bought at $10 thinking it was cheap, although today it is 50% cheaper...
Now, logically, you should have been buying. An excellent entry point was buying DOT at less than $5, ideally in the $4 range. However, if you haven't bought yet, don't regret buying DOT at $1 more. It's worse to buy when it's already at $7 in this Christmas rally.

DOT ANALYSIS (6H)From where I inserted "Start" on the chart, it seems that the price entered a correction.
This correction is a triangle or a more complex pattern (diametric or symmetrical).
From the green area, it can move towards the targets.
Closing a daily candle below the invalidation level will invalidate the analysis
For risk management, please don't forget stop loss and capital management
When we reach the first target, save some profit and then change the stop to entry
Comment if you have any questions
Thank You


Dot Making two scenarios one is bullish second one is BearishDot is testing the 200 EMA a key level holding strong since 22nd April. Butt at the same time it already break the descending trendline which make a bullish trend. As we see market is already in Bullish Mode so i am expecting a 30% bullish movement once it break 7.50 with Sl 6.20. Once it break the EMA 200 you can easily aim for 8,10 and the final one is 11,

DOTUSDT IDEAHello Trading view Family / Fellow Traders.
I hope you have used and benifited from the previous analysis .
In today trading session we are monitoring DOTUSDT for a buying opportunity,
DOTUSDT UPDATE
Breakout of the Falling Wedge Pattern has almost complete ,In 8H Timeframe✴️
So,I Expect a Bullish move of +35%💸

$DOTUSDT TRENDLINE BREAKOUT Dear Traders,
We are convening a discussion focused on #DOTUSDT
THE Trendline Breakout Has Already Done ✅
So,I Expect a Bullish Move of 35% 🚀
Regards: AnnaTradeCharts
#Bitcoin #Crypto #Ethereum #Cryptocurrency #CryptoTrading #BTCUSDT #ETHUSDT #ALTCONS #USDT CRYPTOCAP:BTC CRYPTOCAP:ETH CRYPTOCAP:USDT CRYPTOCAP:PEPE CRYPTOCAP:DOGE NASDAQ:ALT

#DOT Possible Scenario 🔥#DOT Possible Scenario 🔥
Bounce from Trendline
Bounce from support zone
High volume breakout.
See you on the Moon 🌙

DOT We see a classic ascending triangle pattern in the chart. In my opinion, this is one of the best positions in the market. Good luck

DOT We see a classic ascending triangle pattern in the chart. In my opinion, this is one of the best positions in the market. Good luck

DOTUSDT Dotusdt is in bearish trend testing fib 0.5-0.618 with channel top making LH , with no divergence at bottom

$DOT weakening structure#polkadot #dot price chart is exhausted after the relief rally, needs some correction in MID TERM, not short term. Not financial advice.
