Nvidia"Technical analysis suggests Nvidia may be forming a bull pennant pattern, potentially indicating future price movement within the range of $620-$1100."
NVD trade ideas

(NASDAQ:NVIDIA) STOCK AT $100 POST SPLITTWO POTENTIAL BUYING OPPORTUNITIES UNDER $100
Key Information Breakdown
Stock Split Details
A 10-for-1 stock split means each share will be divided into 10 shares, reducing the price proportionally.
Post-split, the price of NVDA will be more accessible to a broader range of investors.
Current and Projected Prices
Current All-Time High: $1,120.08 per share.
Projected Price Post-Split: $106.425 per share (immediate post-split value).
Potential Price Dip: If the stock drops to fill the gap at $960.20, post-split price would be $96.02 per share.
Support Levels:
Before Split: $750.25
After Split: $75.025
Long-term Projection: Based on projected earnings and a forward earnings multiple of 39, the stock could reach $2,266 per share barring any splits or other significant events.
Potential Price After Five Years
The stock could jump to $58.11 per share after five years, considering typical market conditions and growth prospects.
Historical Performance
Five years ago, NVDA stock was priced at $33 per share.
The stock has since exploded by more than 3,000%, reaching $1,102.44 as of the latest open.
Analysis of Factors
Stock Split Impact
Perception and Accessibility: Lower share prices post-split could attract retail investors who find the new price point more accessible.
Liquidity: Increased number of shares could improve liquidity, making it easier to buy and sell shares without significantly affecting the price.
Market Conditions and Support Levels
Gap Filling: Technical analysis often considers gaps in stock prices as levels that need to be filled, suggesting possible dips to $96.02 post-split.
Support Levels: Strong support levels at $75.025 post-split could act as a safety net, potentially preventing further declines.
Long-term Growth Projections
Earnings Growth: Multiplying projected earnings by Nvidia's five-year average forward earnings multiple suggests substantial long-term growth, with potential stock prices reaching as high as $2,266 per share in five years.
Market Trends: Assuming the broader market trends remain favorable, and Nvidia continues its trajectory in technology advancements and market dominance.
Historical Performance Insight
Nvidia's historical performance shows a significant increase in stock value, with a more than 3,000% rise from $33 per share to over $1,100.00 in five years.
This explosive growth reflects Nvidia's ability to innovate and capture market share in high-growth areas like GPUs, AI, and data centers.
Opportunities to Buy
Under $100 post-split:
Two potential buying opportunities under $100:
If the current all-time high is the peak at 1,120.08 a drop to $960.20 ($96.02 post-split) might occur to fill the gap.
Next strong support level at $750.25 ($75.025 post-split) provides another entry point.
Conclusion
Nvidia's 10-for-1 stock split could significantly impact investor perception, making the stock more attractive and accessible. The historical performance suggests that Nvidia has a strong track record of growth, increasing more than 3,000% over the past five years. While the stock might experience some volatility, with potential dips to $96.02 and support at $75.025 post-split, long-term projections remain robust. Based on historical performance and future earnings estimates, Nvidia's stock could reach impressive highs, potentially hitting $2,266 per share over the next five years. Investors should consider these factors and monitor market conditions for optimal entry points.
🚀🚀Boost this idea to reach more people like you! 🚀🚀
NFA
PLEASE, DYOR/MYOD!!
Hope to See your Likes 👍 to Support My Work
To Follow All My Ideas, Go to My Profile and Select the Follow Green button 😁
Please Re-Evaluate Before Make Your Last Decisions
Check my Profile for more.

NVIDIA IS UNBEATABLEEveryone calls for its inevitable downfall but they keep going stronger and stronger.
For me, its way too dangerous skys are too high and buying for me here would be an act of fomo.
but anyone who invested 200-300-400-500-600 i hope you enjoy the ride because there are no signs of running down.
unlike gamestops nvidia has a really strong foundation to base its money on, so i wouldnt expect a sharp downfall.
please be advised and look for any dips below 200 EMA at 4 hourly charts and daily charts
if theres no sign of any, just enjoy the ride: YOU WON

$NVDA #Nvidia Gain on positive news:
#Nvidia reported a 262% increase in revenue and a 462% increase in profits YOY
ALSO:
NVDA
announced a 10-for-1 stock split
Nvidia’s post-split shares will begin trading at the market open on June 10
Nvidia shares rose as much as 4% in after-hours trading following the report
For the Analysis. This was made 2 days prior as a contribution. #Nvda Jumped straight to R2 news released after the bell closed on Wednesday.
(POST WAS REMOVED EARLIER DUE TO RESTRICTED CONTENT).
Will update this post with a new analysis. Stay tuned, Stay sharp;)

NVIDIA LAUNCH TO THE MOONthis is just a wow factor. bullish signals, competency on fleek in the market, global liquidity injections. Nvidia is flying. who ever caught this back in 2022 well done

NVIDIA NVDA - Breaking Upward towards $1000?NVIDIA NVDA continues to swing upwards. We are keeping an eye on the $1000 level. Is this a good time for a call Option entry?

NVDA should not stop until when...NVDA is in a highly speculative scenario. For a long time, I've been seeing analysts shouting that the price is stretched and begging for a correction.
That's precisely what keeps the uptrend going. As long as there is a large number of open shorts and irrational trading of protections, these and other factors are likely to continue acting as fuel.
Some observations:
1 - I believe that the true uptrend (wave I) began in October 2002.
2 - From October 2007 to December 2012, a corrective triangle formation occurred (wave II).
3 - Since then, the most expansive movement of the trend started (wave III), peaking in November 2021.
4 - During the year 2022, we might have seen another corrective pattern of a smaller degree (wave IV).
5 - And now, we would be witnessing the development of the final impulsive movement (wave V), with a high speculative degree fueled by the artificial intelligence boom.
Medium-term:
I understand that the price is trading in a pattern that we can define as an uptrend channel, with the likelihood of continuing the previous movement after the breakout. Alternatively, this could also be considered as a distribution channel.
In my perception, the asset is still not doing anything surprising based on its historical movements. I suggest observing longer periods between the years 2015 and 2021 to draw the same conclusion.
The point is that the price is really stretched, and trading it is clearly high risk.
My goal with this post is to reduce the noise of the narrative and opine that there are rational aspects to be evaluated within the asset's own history. And that speculation can persist for a longer period than most people may want to believe.


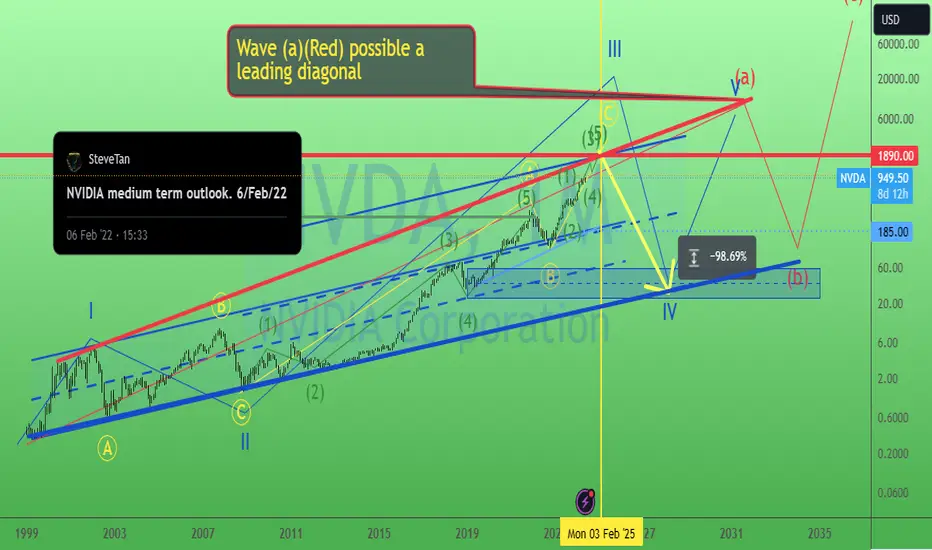
NVIDIA biggest pic. 23/May/24NVDA possible forming a leading diagonal pattern in wave (a)(Red). P/s. It seem like 99% stocks/index chart "showing" year 2025...
NVIDIA. short term swing setup. 23/May/24NVDA just announced a 10-for-1 stock split. So it will be more affordable at $100 +/- than $1000 and "this chart" will be "out of proportion". Support would be @ $900 or 90 +/- (after splitting) if there is a pullback.

NVDA Paths Heading Into EarningsNVDA has a bearish ascending wedge, but has also shown extreme strength and has exceeded revenue expectations 18 quarters in a row. Not something you'd want to bet against, I'd stay bullish above the $925 area, but if it falls below that'll be an ascending wedge break and a key support level break. Can be a good opportunity either way.

peeking at $NVDA levels before its ERNVIDIA Corporation (NASDAQ: NVDA) is expected to report its fiscal first-quarter earnings on **May 22, 2024**, after the market closes¹. Here's what you can anticipate:
1. **Revenue**: Wall Street expects Nvidia's fiscal Q1 2024 revenue to be around $7.19 billion, representing a 234% increase year over year. However, the company's guidance for fiscal Q1 2025 is even more impressive, projecting revenue of $24 billion, a 242% increase¹.
2. **Earnings per Share (EPS)**: For the same period, adjusted EPS is estimated to be $1.09, a substantial jump from the previous year. Looking ahead to fiscal Q1 2025, Nvidia's guidance suggests an adjusted EPS of $5.41, reflecting a remarkable 411% increase¹.
Given Nvidia's strong recent performance, expectations are high. To drive the stock price higher, the company will likely need to comfortably beat Wall Street's estimates and provide optimistic guidance for the next quarter¹. Keep an eye out for the official report to see how Nvidia fares! 🚀📈
***** this note was brought to you from the power of Microsoft Copilot *****

Why Nvidia Stock Could Continue Its Bull Run After May 22This year has been remarkable for Nvidia (NASDAQ: NVDA) investors, with the company's shares surging more than 91%. The stock's momentum might receive a further boost when Nvidia announces its first-quarter fiscal 2025 earnings on Wednesday, May 22.
Nvidia is set to release its quarterly report amid favorable trends in the artificial intelligence (AI) semiconductor sector, potentially enabling it to surpass Wall Street's forecasts.
KeyBanc analyst John Vinh projects Nvidia will report Q1 earnings of $5.81 per share on revenue of $25.6 billion, which is higher than the consensus estimates of $5.57 per share in earnings and $24.6 billion in revenue.

NVDA watchout - Bearish rising wedgeNVDA is poised for breakout on earning day. if breaks Supply Zone, it will fly high. Otherwise, free fall from 975 level. If anyone wants to trade, wait after the earning. Or create Iron Condor well above 1000 level and below 850 level. Expect the stock to go up 5/21 and 5/22. Short call will work. See yellow lines in my chart.
Pattern: Bearish rising wedge

NVDA HOURLY BULL FLAG Notice the momentum shifting to the upside with 4h Highs to takeout. 1h showing strength flagging post market, may be a good breath before price exhales at open tomorrow.

NVDA will go higher this year You can see I set the target ZONE and it will most definitely get there :)

NVDA:MICROThe butterfly pattern has been formed.
Nvidia's buying is very strong.
It would be fun to see if you can break through the highs.


NVDA looking to pullback and then go for higherNVDA may pullback and then continue higher to break structure. Look for pull back bounce up

NVIDIA SHORT TERM MOMENTUMFalling wedge pattern + Inversed bearish FVG on 30 min. I think there will be a sweep of SSL (former double bottom) before seeking higher.

NVDA, big pictureI prefer to use Elliott Wave Theory for following equity markets, gold/silver, and Bitcoin, and I avoid using Elliott Wave Theory for individual stocks, with a few exceptions (MSFT, NVDA, and a few others).
I do think NVDA wlll make a move above 1000 soon, with an ideal wave 5 of (3) to be above 1150. Its bounce from 756.06 looks to have a plenty of potential to get to that level. After that, I would expect wave (4) to be relatively quick and come back towards 800-900 area.

NVDA: Prepare to short into resistance zoneAs drawn in the chart, expects 966- 974 to be the resistance zone and thus a good short candidate in terms of risk-reward.

Ichimoku Watch: Nvidia Preparing to Charge Higher Ahead of EarniUpcoming Earnings Release:
NVIDIA Corporation (ticker: NVDA) is scheduled to report earnings on 22 May. The consensus EPS estimate for the fiscal quarter is $5.15. The reported EPS for the same quarter a year prior was $0.88.
Bulls In Control
From the Ichimoku Indicator, you will see that the Leading Span A crossed below Leading Span B, but the thing to monitor is that the Leading Span A is facing higher and appears poised and ready to move back above the Leading Span B line, which is considered a positive for the major tech stock. Price is also above the conversion line and the base line (another positive for the stock), along with the conversion line recently crossing above the base line (also positive).
The trend in this market is still clearly biased to the upside. Adding to this, for traders who follow chart patterns, you may also recognise that recent price action formed a bullish flag pattern ($922.20-$890.11) and established a minor close above the pattern’s boundary yesterday. This is now considered a completed pattern and will prompt some traders to plot the pattern’s take-profit objective beyond $1,000 to $1,019, a record high! It is also relatively clear to see that during the last correction for the stock, following the all-time high of $974.00 in March, volume has decreased. Ultimately, therefore, traders will be looking for an increase in momentum and volume.
Price Direction?
The chart largely points in favour of bulls at the moment. This will be further cemented should follow-through buying take shape above the recently completed bullish flag pattern. However, an alternative scenario to remember is the possibility of a pullback to retest the area between the conversion line and the base line before the stock attempts to find higher ground.
DISCLAIMER:
The information contained in this material is intended for general advice only. It does not take into account your investment objectives, financial situation or particular needs. FP Markets has made every effort to ensure the accuracy of the information as at the date of publication. FP Markets does not give any warranty or representation as to the material. Examples included in this material are for illustrative purposes only. To the extent permitted by law, FP Markets and its employees shall not be liable for any loss or damage arising in any way (including by way of negligence) from or in connection with any information provided in or omitted from this material. Features of the FP Markets products including applicable fees and charges are outlined in the Product Disclosure Statements available from FP Markets website, www.fpmarkets.com and should be considered before deciding to deal in those products. Derivatives can be risky; losses can exceed your initial payment. FP Markets recommends that you seek independent advice. First Prudential Markets Pty Ltd trading as FP Markets ABN 16 112 600 281, Australian Financial Services License Number 286354.
