DOWUSD trade ideas

Us30 potential long to end the week Nice range to retrace back into the 4hr Order block to take higher
Paytience pays

BullishPrepare for higher highs.Dont mess this up.
HH and HL it's that simple, risk very little and keep the larger picture in mind.

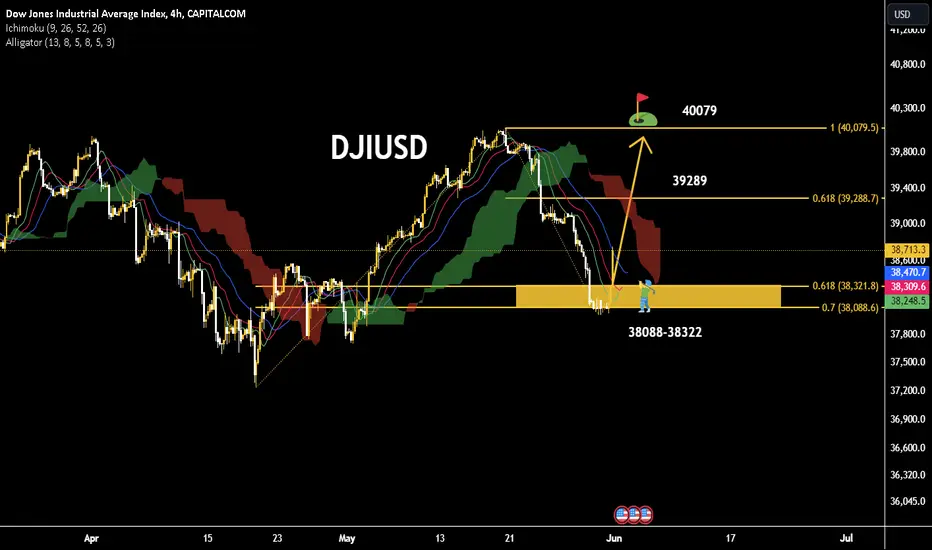
NEW IDEA FOR DOWJONES The increase in the Dow Jones index due to the increase in profits from the income of companies
By examining the trend in the four-hour time frame, the Dow Jones index, having an important support interval in the range of 38,322-38,088, can increase to the previous ceiling resistance in the range of 40,079, in the meantime, the 61.8% Fibo resistance will be seen at 39,289.
DJI30 39000 looking weakAs I posted earlier about DJI30. It’s now tested 39000 multiple times and looks extremely weak. A break of this will accelerate a sell off. Look at my previous posts for major levels.
THIS IS NOT FINANCIAL ADVICE.

US 30 short - scalp trade Taken a nice small short scalp on US 30 to finish the week.
Entry 39137
TP 39114
SL 39157
Entered on the break of the lows on the 1min targeting the imbalance.
As long as we do not break and close above 39195 expect lower pa targeting the HTF sellside sitting around 39030
IF we break above 39195 we will continue higher toward yesterday's buyside liquidity
Noted the 15min breaker (blue box) which should be your main point of reference before trying to find entries on the LTF
Hope you guys have a great week and made the best out of every single day. Hoping you gained some better insight into your trading and that you've learned more about your system and yourself throughout this week. As always... regardless of your bottom line for the week (ending green or red)... this is just one week in the many more to come in your trading journey...don't fall for the illusion of achievement or failure...we LEARN AND GROW EVERY SINGLE DAY
Stay safe and never risk more than 1-5% of your capital per trade. The following analysis is merely a price action based analysis and does not constitute financial advice in any form.


Chance of Recovery in DowThis is a simple long idea for the Dow:
We had a heavy sell off today, now the VOLD is building a very clean double bottom.
Let's seize the chance for a decent reversal.

US30USDUS30USD - The Price has given a breakout from Potential Reversal Zone of Bearish Bat Pattern
Sellers will remain in control. Before Reversal, we have observed bearish divergence.

Us30According to the previous increases, the us30 chart is currently in price correction and it is expected that the price will reach its original position. According to the technical chart, buyers and investors will start buying and the volume of demand will increase, which will increase the price of us30.

US30 IS NOW ON BEAR PUTSOrders Placed, no pending, all executed in time before the market made an impulsive move to the down side.
Aim for a 50% retest zone, then call for buys on corrections, and sell again on impulsive move targeting PSTG 1 & 2

DOW JONES INDEX (US30): Waiting for FOMC
Do not forget, traders, that tomorrow we are expecting FOMC.
Ahead of these fundamentals, US30 started to consolidate
within a narrow intraday range on a 4H time frame.
I will wait for its bullish breakout for a strong bullish confirmation.
4H candle close above that will confirm the violation.
A bullish continuation will be expected then.
❤️Please, support my work with like, thank you!❤️


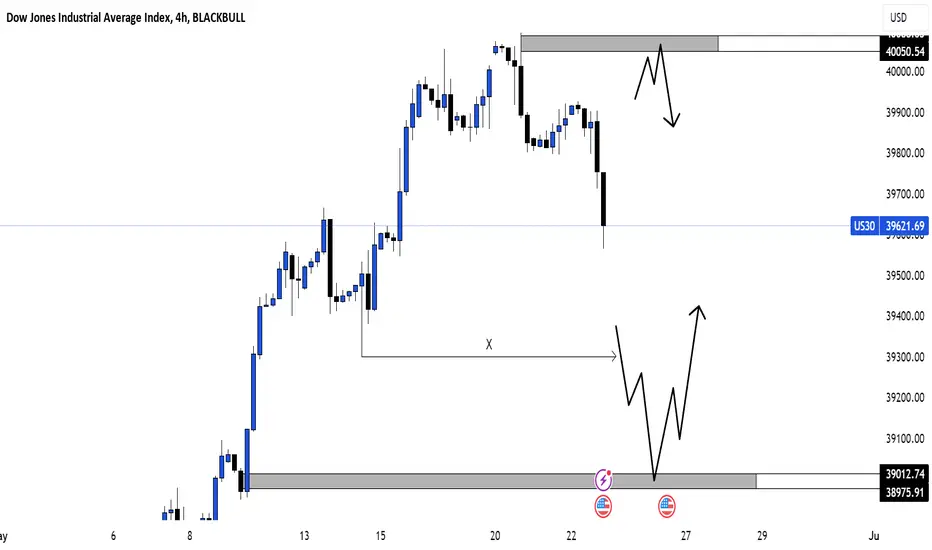
CHART BREAKDOWN US30: Key Levels, Targets and Thoughts!🎯Brief Description🖊️:
The chart provides insights into critical market levels, emphasizing an essential demand zone (medium-risk buy zone) spanning from 39013 to 38975. Additionally, medium-risk sell zone between 40050-40090, respectively, are highlighted.
Things I Have Seen👀:
Medium-Risk Buy Zone🟠: Noted between 39013 and 38975, suggesting another area with moderate risk for potential buying positions.
Medium-Risk Sell Zone🟠: Noted between 40050 and 40090, suggesting another area with moderate risk for potential selling positions.
Bearish Targets📉:
40000: Possible retracement area.
39900: Possible retracement area.
39800: Area with laying low liquidity.
Ultimate Target: 39600- Essential Demand Zone
Bullish Targets📈:
39300: Possible retracement area.
39560: Possible retracement area.
39700: Possible retracement area.
39850: Possible retracement area.
40100: Area with a lot of liquidity.
What's Important Now❗
Currently, the crucial approach is to wait and observe the price action at this level. We need to assess how the market reacts before considering any decisive moves. Stay observant and responsive to real-time developments in the market.

US30 SHORT IDEA "Seizing the Downturn: US30 Short Trades with High Risk-Reward Potential. These trades are strategically positioned to capitalize on market shifts, offering a clear opportunity for favorable returns amidst downward momentum Look promising as of now lets see where it leads

US30US30 Technical analysis
in this Analysis we can see some sell level which I shared, watch it carefully and follow price action.

Dow H6 chartHello every one
As we all expected, Dow starts a bullish trend from the first day of the week but we do not know if last week correction finished and what I have counted is correct or it is just wave b intermediate of ABC of wave 2 Primary.
Note : There is another scenario that say we are in huge recession and what is happening is internal wave of an ABC cycle (or super-cycle) of a big bearish correction. ( But I do not believe in it).
I am sure will face a dark recession in the market but it is nor for now.
The worst problem for every trader is living a doubt and hesitation but we should learn it.
Time will show us.
Thanks

US30 bound for more significant GROWTH this year!US30 companies has cooled down a bit this past few weeks -- warranted correction caused by the overheated valuation of the top 30 companies in the US.
Based on recent data metrics, it looks like the much needed market hibernation has been factored in already, and its ready to grind again. Upside continuation is to be expected from the current levels of 39000.
We maybe seeing new highs again soon as current price movement is already hovering at the peak resistance line -- a thin poke will just squeeze this further up.
Most major companies are starting to report rosy figures already which is good for the overall market.
Spotted at 39500.
TAYOR.

Swing watch: Retrace to 50% fib, look for reactionOn the weekly, price seems to be retracing on the daily bullish range. I am waiting for a reaction on the 50% fib to determine if it will reverse to the upside from there or continue lower to take out the weekly FL/sell side liquidity.
On the hourly, I am looking price to retrace upside on the bearish range to test 50% fib, for a reaction to continue upside or impulse downside to that daily 50% fib I mentioned earlier.

The Mother Of All Shorts Beckons!Markets have topped out after months of belief that the Fed would drop rates.
The Fed will NOT drop rates until the economy is in recession and the markets collapsing...that is how they function.
An initial selloff into mid April has been met with a weak bounce so far, this is your prime moment to load your shorts and prepare now for the mother of all bear markets.
Most do not see the underlying rot and veneer of manipulation, when all else fails, they take us to war...that is their distraction from the truth.
God Bless you all and good trading!

US30 SELL NOW!!!!!!!!!!US30 Made a new highs today completing my last previous analysis predictions on us30 now price just run liquidity at 39900 am expecting further drops on us30 till 37800 is completed now am looking for bearish moves
JOIN AND ENJOY..........

US30 (DowJones) - 4H a bearish correctionThe Dow Jones has recently captured liquidity above the previous high, as indicated by the sharp move and subsequent rejection from the highlighted resistance zone.
This failure to consolidate above the resistance suggests that the bullish momentum has temporarily exhausted, and we could see a retracement.
The price is likely to pull back to the green support zones marked on the chart before attempting another bullish push.
Traders should watch for potential buy opportunities at these support levels, anticipating a bounce and continuation of the upward trend after this correction.
