JP225 : Swing, 100% Price ActionJP225 : Follow the uptrend. Look at my other analyzes, great profit :)
Feel free to like❤, comment📝, share👫 and follow me for other analyzes🌍
I predict with the best probability the future trends, my ideas are reserved for the experienced trader. #UniversTrader
NKCJPY trade ideas

NIKKEI : Swing, 100% Price ActionNI225 : Follow the uptrend. Look at my other analyzes, great profit :)
Feel free to like❤, comment📝, share👫 and follow me for other analyzes🌍
I predict with the best probability the future trends, my ideas are reserved for the experienced trader. #UniversTrader

Warren Buffett Invests in Japan - Economic War 2020 - CurrencyAs the world watches the USA capital markets squeeze themselves into just 5 or 6 large cap, over-hyped, mania stocks (Tesla, Apple, Amazon, Google, Facebook, Microsoft, etc.), the richest (1%) are avoiding U.S. stocks altogether. Warren Buffett has just announced his buy-ins into Japan (over past 12 months). *Warren Buffett made gained his massive "unrealized" returns by accumulating stocks just after the great depression. He then held pretty much his entire lifetime. I don't believe Warren has an edge at all anymore. The world has moved lightyears ahead of what the baby boomer generation can generally comprehend. Sorry Warren, stash the cash, go enjoy your family. Your best days are behind you.
Invest in small cap USA or watch the USA struggle for years. Sad stuff. DON'T INVEST IN JAPAN LIKE WARREN. Don't live on leverage like the majority. Invest smart. CONTRARIAN.
INVEST IN $GNLN or other small cap USA companies. Go USA!!! #cannabis
#federalize
#risksavageinthemarket
#maxcreativeinvesting
#watchthis
#stockmarketcrash2020
#cannabisboom2020
#greenlaneholdings

Btcoin to be pumped by NI225 MTH ATH's, SPX, TNX, & WTI Like the last QTR of 2017 Btcoin to be pumped by NI225 MTH ATH's, SPX, TNX, & WTI NOT ADVICE DYOR


JP225 still weak?JP225 is still stuck at the resistance and may rebound to one of the Fib Extension entries which complies with SnR.
TP: 23606.4


NIKKEI 225 Daily Bearish BAT
price need to follow Green Trend line & hit target
If price Breaks Red Trend line is where EXIT before SL hits
POTENTIAL SELL

Possible Sideways Trend For Nikkie Butterfly this Idea is in the Next Part in my Confirmed Previous Idea.
in the past Idea, Nikkie could not break 1.27 Fibo Level.
and it is possible to make a sideways trend for Nikkie.

Correction Step Is Done.Impulsing Step Will Startthe detail is shown on the above Idea.
this Idea is in the Second Part in my Confirmed Previous Idea.


nikkei trade planwhat we have on the daily chart is : a break out of a down trendline and the market turned the resistance into support...the market can push up to the feb highs

NIKKEI 225 INDEX Daily BEARISH BAT
price need to follow Green Trend line & hit target
If price Breaks Red Trend line is where EXIT before SL hits
POTENTIAL SELL

JP225USD (NIKKEI) SHORTDisclaimer
This is not investment advice. Trading entry need more research and real-time confirmation.
*Please do comment n follow me for more educational contents.
*For more inquiry, shoot us a message at our profile.
Thank you for supporting us!
All the best Traders!!,
Zalraki

JPN225Similar analysis as us30. After a major rally to the upside followed by a channel correction phase, price managed to break above key resistance and channel and is correcting itself with bullish continuation flag pattern. Scaling down to smaller timeframe (maybe 15m) and waiting for a break of flag for possible long opportunities. Major tp set to pre-pandemic resistance around 24075. Would recommend taking partial profits along the way. Staying updated on any news release.


NI225, Elliot wave analysis 16/07/2020I am still short on this market and you can sell when the confirmation level is broken

Jpan225/NI225 elliotwave Update 21.07.2020we are at the wavw 4 correction and be rady for a big crash when the wave 5 finishes

Retest Golden Level Before Than More Falling the detail is shown on the above Idea.
this Idea is in Continuation of my Confirmed Previous Idea.
Although Bullish Trend was More than I expected ( NIKKIE Rise up to Fibo Higher Level)
Dear Friends Leave us a comment or like to keep my content for free and alive.
God Bless you and your Parent.

TREND ANALYSIS CONTINUATION 5From our previous discussions we found the values for AB and BC with the 133 days overlap
Wave AB without the 133 overlap = (1400 days / 1041 pts)
AB = root(1400² + 1041²)
= 1744.61 units
This value is equal to the total price advance for the 17 year cycle, i.e the vector 1744.61
standing vertically upright from the origin 6995 price level points exactly at the current high
24475 price level.
24475 - 6995 = 17480 points (dividing price level by 10 gives us 1748.0 units)
Wave CD = (2478 days / 13958 points)
CD = root(2478² + 1395.8²)
= 2844.07 units
ratio between AB and CD = AB/CD
= 1744 / 2844 = 0.613
Wave BC from 26/02/07 to 28/10/08 = (610 days / 11139.2 points)
BC = root(610² + 1113.92²)
= 1270 units
ratio between BC and CD = BC/CD
= 1270 / 2844 = 0.447 (0.447 is the inverse of root 5)
OR: 1270 * 2.236 = 2839.72 (approx = 2844 = CD)
Wave AB with the 133 days overlap = (1400 + 133 = 1533 days / 1041 points)
AB = root(1533² + 1041²) = 1853 units
AF = (24475 - 6995 = 17480 points / 6077 days)
AF = root(6077² + 1748²)
= 6323.4 units
ratio AF/AB = 6323.4/1853 = 3.4125 (approx. equal to a 3.4142 compound area)
This area will have composites of two squares and a root2 rectangle as discussed in the video.
This area is the largest spiral that defines the 17-year cycle ending on 24th August.
The correction to this cycle is a 7-year cycle which is also overlapping and ending December 2021
In our next discussion we will try to model this ending part of the correction phase.
Thanks for your time

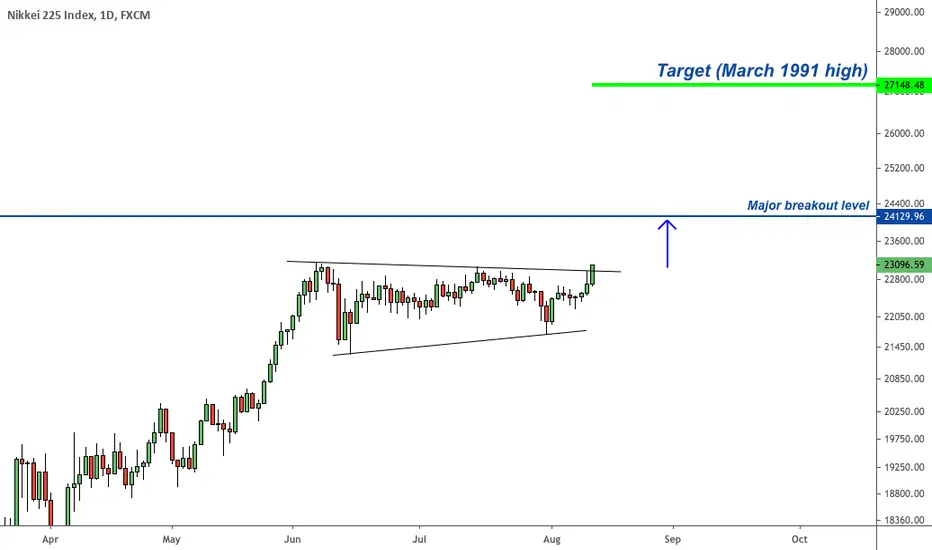
Japan's major index is breaking out. Follow the money flow...While the Nasdaq is turbulent the Japanese Nikkei is breaking out and headed toward a major level. Long into that zone, then we'll see if there's follow through. A break above the major blue level sends the Nikkei much higher.
Bigger picture: