NKCJPY trade ideas

Japan 225 (Nikkei)Never traded this pair but found a nice setup. How do you guys feel abut this one?

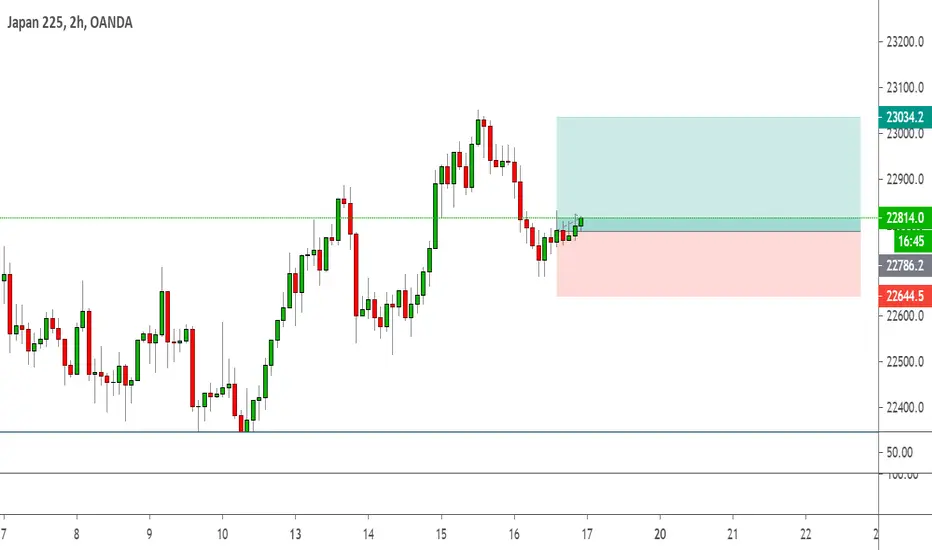
JP225 SHORTA bullish push will accumulate positions in this scenario, temporal longs can be taken but highly risky. We saw the beginning of the week showing bullish sentiment price later dropping and breaking previous structures or lower high. we should see price reverse find supply to sell off into what i hope is the new bear market in the month(s) to come but i will monitor price and be reactive rather than predictive.

More Bullish potential on NIKKEI by ThinkingAntsOkMain items we can see on the chart:
a) The price has re-entered a broken ascending channel (yellow lines)
b) After that, we observed a corrective formation above it (purple lines)
c) We expect a bullish resolution of this correction based on Technical Analysis Theory
d) Target is the next Resistance zone

JP225USD_ Targerted Area for LongRSI confirmation to this expanding triangle, waiting for candle confirmation.

Best Times To Play The Markets, Swing Trader Perspective.Here we have a chart of Nikkei 225 index on a 3 day chart.
Nothing is more powerful than identifying potential trend reversals, notice that I said "potential".
Nothing is guaranteed when it comes to trading, you will never be 100% winning in the markets.
The only edge that you have when it comes to trading is identifying trend accumulation, distribution and risk management following an overall trend. If you apply S&R to a 5 min chart vs 1 week chart, which ones levels do you think will play a more valid role in the markets? The weekly will 100%! You better be a trained professional and have a good track record of experience if you think you're just going to show up to work everyday and try to scalp every single little move sitting in front of the monitor 24/7. I personally 100% believe the big picture is where it all counts. I believe the proper way to trade the markets is to use it as an investment vehicle to work for you over time. This is why on most of my charts you will see I'm a fan favorite of the daily chart and up. These timeframes are critical to identifying the major trends in the markets. You will be chasing your tail more than anything in a 5 minute timeframe and most likely realize why trading has such a high failure rate. Let the trade come to you!
If you can learn how to manage risk and not let a bad trade get away from you, then you are already one major step ahead of the pack of failing retail traders. You see... this understanding to cut loss quick is more important than anything you will ever learn from the markets.
The mentality of most retail traders is the famous "I want to get rich fast" mentality. When a trade goes against them, most have a tendency to hold onto that position with hope's to recover... this is how most blow their accounts. A lot of traders with this mentality tend to think they need to borrow money that they don't have from their broker, as if having more working capital will get them richer faster. If you can't trade with $25 in your account, chances are you probably don't need to use $25,000 to trade with. Most traders learn to become impatient with the market and use the lowest of timeframes where most of the noise in the markets occurs.
Are their success stories of traders that made it as daytraders? ABSOLUTELY!
I'm sure they went through years of training and learned to correct their failures. You can't let the markets beat you up if it goes against you and call it quits. You have to stay consistent and let every failure become a valuable learning lesson. It's going to take time, this is one of the hardest jobs on the planet if you choose to make it hard.
----------
So what do I look for? Like I said above I focus on trend trading from a technical analysis stand point. Observe the candles on the chart above. Green is buy pressure and red is sell pressure. Big bricks stronger pressure and compression doji bricks are weakened pressure. My goal at the end of the day is to look for the trend transitions at points of exhaustion. Notice how at the bottom of the crash the bricks began to compress to form a doji that shifted green, That's my transition. Look below and see the ema dots then also shot green and the custom rsi left oversold territory. That is your opportunity. You will manage your risk at these turning points. If you take a small hit and get stopped out, oh well. You managed risk and didnt let a trade get away from you. You can't control the market, you can only walk with it and not let your ego get in the way of trading.
Now you see that we have tight compression forming up top of this major trend reversal from the bottom. Ema dots going red and the custom rsi is shifting down from overbought territory. These are the ideal times I look to trade. If I drop down to a daily I see that we have a valid Resistance level as price rejects off of it based off previous level. Will this Resistance hold strong to selloff? Who knows! The market makers will create the next move, not you. You have to play both sides when the time occurs. That Resistance is my edge.
Price goes up and price goes down. In order for the price to go up or to go down it needs to transition in a sideways manner to accumulate or distribute in any market. My best chance of trading is finding these major potential reversal points, especially ones like this with such a tight compression and managing my risk. I will risk a small amount on a stop and diversify my portfolio. The market will not trend sideways and flatline forever. All you need to do is find these trend reversals, manage tight risk in anticipation to capture the next major trend.
*This material is for educational purposes only

NIKKEI 225 Daily BEARISH BAT
price need to follow Green Trend line & hit target
If price Breaks Red Trend line is where EXIT before SL hits
POTENTIAL SELL

Nikkei 225On a cusp of making up for its lost decade
Trade at your own risk . My personel opinion and not to be taken as investing advice .Do your own research.

Nikkei and JPY short termDue to strong correlation with USD the Japanese currency is expected to devalue for a bit when USD devaluation accelerates. At the same time the Nikkei will show a rally exactly as is expected of then DJI.
UJ Seasonality approved ;)

Possibility of Bearish Trend After Retest 0.88 Levelthis Idea is in Continuation of my Confirmed Previous Idea.

NI225 FALL more ( Gartley Pattern)the detail is shown on the above Idea. Bearish Trend Likely Will Continue more even After Breaking Golden Line
according to Gartley harmonic Pattern.


NI225 Is Rising Slowly and Loosely. ( Gartley Pattern)this Idea is in Continuation of my Confirmed Previous Idea.
(this idea is a Global Review Idea. not trading )

JP225USD LONGWith jp225 we are overall bullish this week. On the daily time frame, since last week Wednesday we've been on a corrective structure.

Nikkei 225 Index Marco Trading OpportunityDear traders and friends,
Hope you have a great day so far!
A potential trading opportunity might come very soon based on the analysis of the macro trend. This index has been traded and accumulated within a low price region for decades, but the trend has gradually reversed since 2009. A potential broadening right angled ascending that formed in the past few years could trigger a big explosion. Please see the chart.
Don't forget to like, leave comments and follow me if you're interested in this idea. Enjoy!
HakoneDream


NIKKEI IN 01HOURJapanese treasury index on an uptrend, probability of falling down in the coming days.

JP225 : Swing, 100% Price ActionJP225 : Follow the UpTrend.
Feel free to like❤, comment📝, share👫 and follow me for other analyzes🌍


NIKKEI, in the wave V too?we saw that the nikkei index is in the wave V too, as the dax and the spx500.
you can see the indicators of "tercermundo", that confirms it.
QQmom shows the end on wave 3.
QQrsiDivs shows the bearish divergence between wave 3 and wave 5.
XTL-VMA is the indicator based in the studys of tom joseph, which wrote mechanical trading book.
And finish, the ewo is the elliot indicator with bands, based in tom joseph studys.
you can find us in the telegram channel , which appaers in my sign.
Regards!

Nikkei 225 H4 Long High to Resistance zone (Channel Up)Nikkei 225 H4 Long High to Resistance zone (Channel Up)

