US July CPI: Disinflation Continues, but the Details Warn AgainsUS inflation moderated in July, with headline CPI rising 0.1% month on month and easing to 3.4% annually. Core inflation also declined to 2.5% year on year, but the internal composition was less dovish than the headline suggests.
In this video, we examine:
Which sectors led July’s inflation
Wh
Key data points
Last release
—
Observation period
Jul 2026
Next release
—
Forecast
—
Highest
2.00 %on Sep 30, 1947
Lowest
−1.80 %on Nov 30, 2008
Details
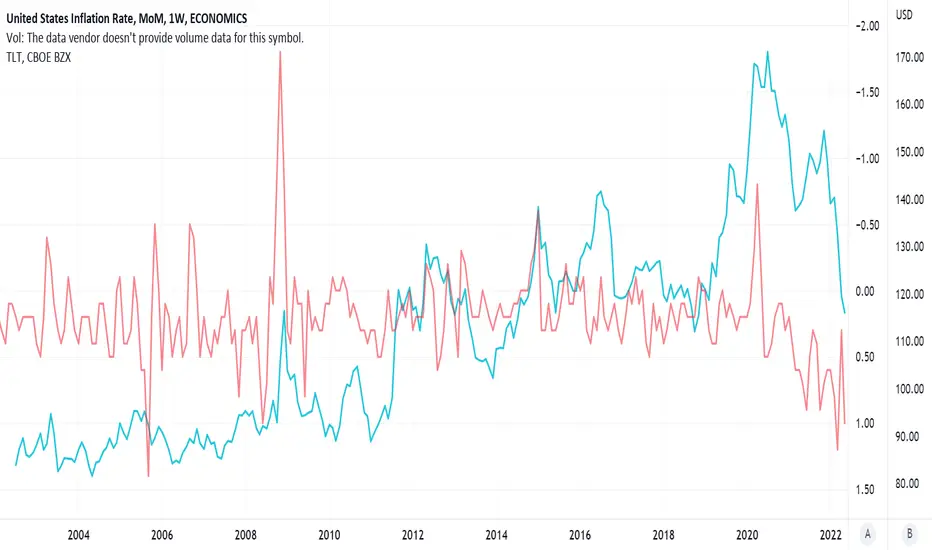
Inflation Rate MoM measures month over month change in the price of goods and services.
Related indicators
US CPI MoM new 3.5 year highEnergy Shock Masks a Quiet Core
Headline CPI surged 0.9% m/m in March — well above the 0.7% consensus — after a modest 0.3% gain in February. On a yearly basis, total inflation accelerated to 3.3% from 2.4%.
Core CPI (ex food & energy) came in softer than expected at +0.2% m/m vs. 0.3% forecast, mat
Month on Month US Inflation Harmonically Set to Rise to 1.94%This is a followup to this year-on-year inflation chart idea posted back in June 2022:
The YoY US Inflation rate has been on a trend of going down since it tested the 1.414 PCZ of the Bearish Butterfly above, but recently we have seen the MoM rate slow its descent and form a bottoming pattern with
Inflation Will Recede If Oil Price Drops Chart to illustrate the oil prices as a leading indicator of month over month inflation rates.
Inflation statistics mirror oil price action with a lag of about 1-2 months.
"Federal Reserve Chair Jerome Powell said in his semiannual testimony before the U.S. Senate Banking Committee in March 2022 t
See all ideas