ETCUSDTPREP 4HThere is bearish butterfly and we can say it was confirm with fibo to down,, so let see how it could be.. 😁
ETCUSDT trade ideas

ETC/USDT (Futures) Update SHORT #harmonicsignal #Crypto
ETC/USDT (Futures) Update
⬇️Short Signal
Entry at 49.26
⭕️SL @52
🔵TP1 @38.5
🔵TP2 @31.9
Move your SL to entry level after profit 1:1 RR hitted.
*Take out 75% at tp1 remaining for tp2*
Only Risk 1% of your Equity.

#ETCEtherium classic broke through the triangle and brought us more than 60% profit.
Closed 3 targets.
We leave the fourth part open and move the stop to the level of the second target.

ETC Formed Inverse H&S Target $45Hey guys today i'm going analysis ETC/USDT pair
1)ETC is formed now Inverse H&S pattern, and we all know this pattern is bullish pattern
3)We have two left shoulders and two right shoulders and one head, we know we can have multiple shoulders that's normal
4)If we breakout from $30.5 level with volume, and close daily candle behind the resistance line, next target must be $45
5)If we take a look MACD indicator thats also bullish,we have bullish cross already and Histogram is green now, that's bullish signal
If you like my analysis pls like and subscribe me)))

ETC gained 13% this week after breakout of crucial resistanceThe Ethereum Classic coin has been continuing higher and has gained around 70% of its cost since last week.
The Ethereum Classic coin saw a higher liquidated market; therefore, trading volume has been inclining gradually for the past several days.
The Supertrend indicator generated the buying indication in terms of the daily price chart.
The bulls are feeling safe above the 100-day EMA (yellow), which has been a long volatility red zone. At that point, the holders are preparing themselves to close the daily price candle above the 200-MA line. Furthermore, the 20 and 50 MAs are looking below ETC price on the daily price chart.
Stoch RSI is observing an overbought zone in the context of the daily price chart. It looks like the indicator is about to give a bearish crossover; It remains how the bulls will react to this action. Furthermore, the Average Directional Index is at 24-points, indicating a bullish trend for the Ethereum Classic coin.
No doubt the bulls caught the trend of Ethereum Classic coin and are aggressive about buying but still bullish on their way. Bulls need to manage the price of the coin above the 200-EMA as well as the nearest resistance area.
Support level - $25 and $20
Resistance level - $45 and $60

Believe it or not Ethereum classic is going popLong-term resistance ready to break...
The crypto market is bouncing off bottoms so expect mega upside across the market...
BUT my chart setup indicates Ethereum classic looks the best


Ethereum Classic (ETC) Sell ZoneEthereum Classic (ETC) Buy Zone
--------------------
BIAS
Mid-Term : Neutral
Long-Term : Bullish
Risk : High
On 4 hours timeframe, we’re still expecting form out bearish pattern, currently its facing out the mid-term resistance zone.
--------------------
$ETC/USDT SHORT SETUP
Leverage : x3 - x5
Entry Price : 39 - 41
TP 1 : 37.35
TP 2 : 35.9
TP 3 : 34.4
TP 4 : 32.9
TP 5 : 31.45
TP 6 : 29.45
TP 7 : 28.15
TP 8 : 26.75
Stop Loss : 42.25
*Maximum 3% of Portfolio.
*Unload 12.5% at each TP. Whenever TP 2 hits, Move stop loss to entry.
--------------------

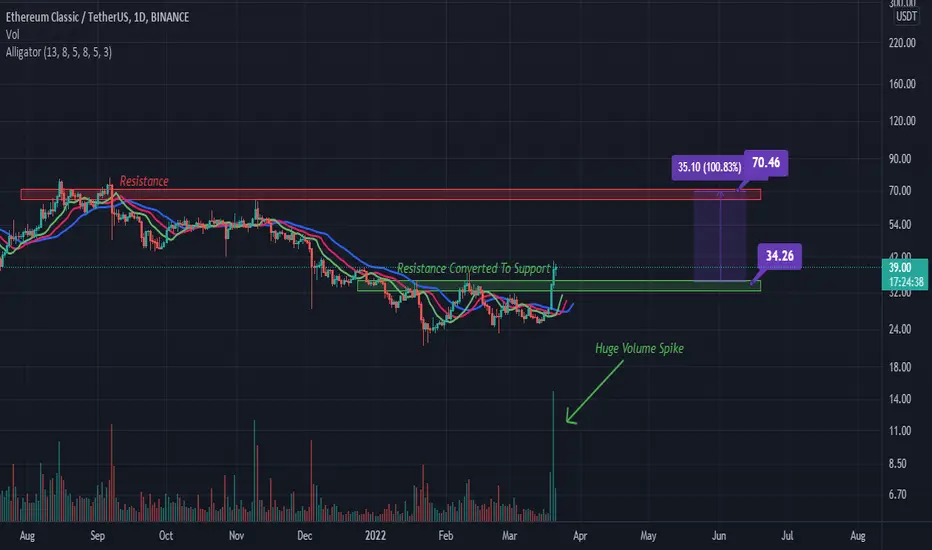
ETC Breakout!!! Tartget $70Hello everyone today i'm going analysis ETC/USDT pair
1)In my previous analysis ETC formed Inverse H&S and ETC must hit $45 price level, and soon
ETC will hit $45 level you can take some TP if you wanna at $45 level range,but in this analysis we look ETC other way, so let's see what we have.
2)ETC have nice Consolidation range at $24-$34,and we can call it Trading Range Bottoms also.
3)ETC had Resistance level at $34 approximately, now ETC breakout from $34 level with high Spike Volume, this Volume confirmed ETC breakout, now previous Resistance level converted to Support level, ETC have now acting support level at $34 price range level.
4)Now ETC can easily hit $70 level approximately because we don't have any Resistance level until hit $70 Resistance level.
5)We also use Alligator indicator in ETC chart,now price is above Alligator lines its Bullish signal
6)We can see Alligator Green line crossing in to Red and Blue lines,and Red line moving upward and crossing in to Blue line,and Blue line is now below Green and Red line, and now Blue line following direction of Green and Red lines, that's mean Alligator is opened his Jaw started hunting upwards trend.
If you like my analysis like and subscribe me)))
ETC/USDT (Futures) Update Short!#harmonicsignal #Crypto
ETC/USDT (Futures) Update
⬇️Short Signal
Entry at 39.5
⭕️SL @42
🔵TP1 @34.3
🔵TP2 @30
Move your SL to entry level after tp1 hitted.
Take out 75% at tp1 remaining for tp2
Only Risk 1% of your Equity.

SHORTING OPPORTUNITY ON ETC FOR PROFITSHello traders, a look into ETC after a rull we expect a pullback or correction . from the chart we can see it tested the month resistance and we expect a pullback , we can short it for some profits. we can see the general market has exhasuted the bull stem, we should either consolidate or pullback for a continuation.
tradehubng.

ABSURD ETC
The 24-hour transaction volume of the whole network is half of the market value of 4.7 billion US dollars, and the result only increased by about 5%. In theory, the increase of 30% is not an exaggeration. If the daily transaction volume of Bitcoin reaches 500 billion yuan ( Usually there is no 100 billion yuan), Bitcoin must not soar more than 20%!
In addition, the 24h transaction volume of etc on Binance exchange is three times that of the second place Ouyi, and more than 10 times that of the third place, while the other top 20 coins will basically be shameless to brush up to 100 million More than RMB, the spot transaction volume of trx is several hundred million yuan more than that of perpetual contracts. ? Or are you trying to cover up the data?

ETCUSDT Midhigher to Daily tf Range Updated till 20-3-22ETCUSDT mid-higher to daily timeframe range, i can see only right swing setups that been worked which was safe too compare to other alt's . not as fancy as other alt's in the market. of course its not as easy as to pump it either. its an old alt with lots of holders and the more heavy it is the more money it needs to pump.so not as shinny as its top competitor less new retail interest it get caught but in crypto market we can always expect unexpected.
ETC Market Cycles and PsychologyDrew from my touch screen toaster.
Refer to market cycles and market psychology.
Sharing all ideas as public from now on.
If you enjoy them leave feedback and I will publish more.
Taking pair request for charting, comment a cryptocurrency pair.

ETHEREUM CLASSIC (ETC) has hit daily EMA200, lock your profit!!OKEX:ETCPERP
Due to the recovery of BTC, ETC pumped over 40% in 2 days after the volatility warning signals appeared.
The volatility warning signal on December 3 was extremely good. The price dropped 40.72% in one day just after the volatility warning appeard.
ETC Daily analysis :
At present, the price has reached the daily EMA200 long-short dividing line + the previous resistance leael = 2 BUFF
Don't bet on breakthroughs EMA200, lock in profits, and take 50% profit first.
The remaining 50% of the positions depend on the 1-hour or 4-hour trend structure of ETC.
If there is a structure of energy exhaustion, the highs gradually decrease as the lows gradually decrease, close all the position.
If the momentum can remain strong, the highs continue to rise as the lows continue to rise, hold the rest of position.
ETC 1 Hour analysis :
Keep an eye on the 1-hour EMA20 and EMA50.
If the price reaches the support area of these two moving averages, and any 2 of the 4 BUFFs appear, you can go long (the more BUFFs, the safer, the better)
1. Price Patten (Double bottom, reversal h&s,etc)
2. Moving Average
3. Candle (bullish engulfing, Dragonfly doji, hanghing man or hammer,etc)
4. Divergence signals
Summarize :
On the daily timeframe, the price has reached the EMA200 long-short dividing line, and locking 50% of the profit is necessary.
on the 1 hour timeframe, you can find patterns and moving average as low-risk areas to open long position
*The risk of each trade is 0.5%~1% of the total assets, and the maximum risk should not exceed 2%.

ETHEREUM CLASSICETC has broken long term resistance trend line and is now testing key horizontal resistance. Is ETC heading for a new ATH this run?


ETC 15min longFollow for more and trade is intact as long as we dont have two candle close's under lowest line

#ETCA triangle has formed that has broken through to the upside. It is possible to take a long with a short stop under the upper line of the triangle.
Target - 35 - 39 - 44 and higher.
I will be glad if you subscribe to the channel and like it)


ATL #ETC/USDTToken #ETC/USDT
x10 profit if owning #etc at the price range of $27
I think you shouldn't miss it

ETCUSDT, We are going to complete Wave CHello everybody
We hope that everyone are in profit in these days of market and a f.. war :(
According to the chart and last analysis that we published, the price was moving in downward trend and we can say that is moving in downward channel.
According to the Elliott theory now are in wave C and we need to complete it, We shown on chart one of the most powerful PRZ level that can the price impact it and ready to move upwards from this level.
But important thing is : PRZ Level is the zone that have power to change the trend not surely do it just have the power.
In these days until Feds event not happend do not trade because its risky for everyone, wait the market show us what gonna do :D
Observe to your capital management
Good Luck
Abtin
Very Previous analysis :D :D :

ETC tradecoin M15Risk warning, disclaimer: the above is a personal market judgment based on published information and historical chart data on Tradingview, all analysis is only subjective. Hope investors consider, I am not responsible for your investment decision. Thank you.
Good luck
