Double Cycle Incoming ?Expecting double cycle as in 2016
History repeats itself in patterns over time.
ETHBTC trade ideas

ETH ecosystem to fund initial stage of crypto bullrunWhen markets rotate the money has to come from somewhere. Money can move in and out of one sector of the economy into the other, like money moving from industrials into technology or from fiat into precious metals. Money can also move around within a macro system from its constituent sub-systems. In the case of crypto, think we will see the Ethereum ecosystem beggared while money flows out of it into other ecosystems.
In order to try and stay ahead of the rotations into and out of crypto and into and out of the various layer one projects within crypto I turn to the best tool I have, which is the charts. Once we have the layer one blockchain we care about we can look at other layer projects that ride on top of the layer one to move up the risk curve for more volatility as we see fit.
ETH/Bitcoin
Bitcoin is the biggest single slice of the crypto by fame and market cap. The double top threat is pretty clear at this point. The black double top appears to be an eve and eve with the difference between the first and second peak about 3.12% That is about as textbook as we could want to see. We just have to start breaking the neckline of the formation and we should start to see more volatility in the pair.
Eth Dominance
ETH.D is likewise in a double top but this one is a bit further away from the neckline. The targeting is much the same. Due to the structures of the uptrend I think that 40% draw down is very reasonable and realistic.
XRPETH
XRP appears to be in a ascending triangle against ETH with a target close to 2x if full performance is reached.
Solana/ETH
Solana is suppose to be an Ethereum killer and in the long run I think it will live up to its name. I think it has a couple of years for the ecosystem to mature before It does. A major sign of strength will be if this W pattern performs to target. That would have Sol putting up over twice the gains than eth does in the initial stages of this move.
Polkadot ETH
Dot has been moving sideway for the last 4 months and has created some bullish divergence on the weekly chart. I think we will see it slowly erode share out of eth.
Kadena Eth
One of my favorite layer ones to watch and maybe trade before I see my long term set up is Kadena. It is poised ot have a W pattern that pops it over 100% against eth.
Cronos Eth
Cro seems to be another coin in a wedge against eth. The target this cycle is over 300% away from the current level.
ADA ETH
Oh, look, it is another coin in a bullish falling wedge against ETH. Sure reaching the previous ATH might take a decade or so, but that is a decade to favor ADA over eth.
Doge Meme Coin Versus Eth
Want to consider something that at first glance seem moronic or hilarious? Doge has the structure to 70x eth over the next couple of years.
Final thoughts
The Eth team has done a lot to make their system more affordable to use. As price goes down the ease of use goes up and the adoption goes up. Ethereum is in the process of turning itself into a volume trade and not a profit margin trade. That might be a good thing for cryptocurrency as a whole but I am chasing alpha. Crypto gives me more potential alpha than equities so I play here. If the alpha is leaving eth then I am going to leave as well, no matter how good it could be for the world or the ecosystem. Daddy can't pay for his girls food and clothes if he doesn't get that alpha.

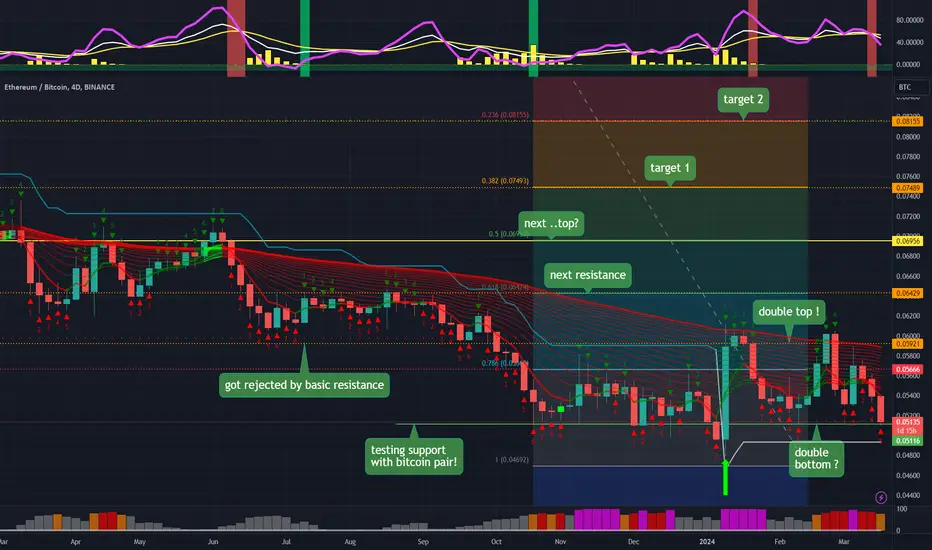
ETH vs Bitcoin ! support level holding !Ethereum is testing again this resistance level with bitcoin
If this support breaks : its bad for ETH -and and worse for altcoins! (we all know that)
However if we are really in a bull market.. well-this support should hold..
But also it may break briefly to scare the bulls... and weak hands !
My bullish targets are on this chart (as always)
Ethereum domain map 2 This is now the general direction of the Bitcoin Ether chart, and when it reaches the shaded area below, it will head again to test the historical top in the shaded area above.
Note: This is a weekly chart, which means it will take some time to fall to the shaded area below, and the average time to rise again to test the shaded area above.
If this chart and dozens of other successful analyzes on my page helped you, please like and comment

ETHBTC Distribution Schematic #2hase A: Phase A in a distribution TR marks the stopping of the prior uptrend. Up to this point, demand has been dominant and the first significant evidence of supply entering the market is provided by preliminary supply (PSY) and the buying climax (BC). These events are usually followed by an automatic reaction (AR) and a secondary test (ST) of the BC, often upon diminished volume. However, the uptrend may also terminate without climactic action, instead demonstrating exhaustion of demand with decreasing spread and volume; less upward progress is made on each rally before significant supply emerges.
In a redistribution TR within a larger downtrend, Phase A may look more like the start of an accumulation TR (e.g., with climactic price and volume action to the downside). However, Phases B through E of a re-distribution TR can be analyzed in a similar manner to the distribution TR at the market top.

ETH BTC diamond bottom and wykoff schematic 2I'm bullish on ETHBTC for the next 2 months.
ETH spot ETF narrative.
The Bitcoin spot ETF was a "Buy the News" event; maybe the ETH Spot ETF will also be a "Buy the News" event.
I like 0.075 ETHBTC.
Sell if the ETJ flipping narrative comes into play.

ETHBTC last chanceETHBTC is at a critical point imo. Looking for a strong bounce around here.
Remember, real fun begins when ETH starts to lead.

📈Ethereum overtake Bitcoin after Dencun update!📉BINANCE:ETHUSDT
COINBASE:ETHUSD
Ethereum can start an upward scenario on the eve of its update.
The condition for the occurrence of this bullish scenario is the stabilization of the price in the yellow range.
after that, the bullish scenario can continue up to the level of 0.06 and after stabilizing above specified level, it can go up to the channel.
✌💥If you are satisfied with my analytical content, please share my ideas💥✌
✍🐱👤Otherwise, make sure you leave comments and let me know what you think.🐱👤✍
🍾Thank you for your support. I hope you will gain profit by following my analyses.🍾

ETHBTC is Clearwe will see higher price as soon as possible and the best decision to trade is right now on power full weekly trend line.

ETHBTC - 14th March 2024 Ichimoku Weekly ChartETHBTC - 14th March 2024 Ichimoku Weekly Chart
Welcome Pirates!
We have just got a TK Cross on the weekly ETHBTC Ichimoku.
Fisher is heading North.
Sqz Momentum green but waning.
IFish curling down
VZO PZO has bottomed out.
Moneyflow is at the zero line and heading south.
So I dare say there will be a little more downside, but we should see this bad boy turn around back up to the 0.06 zone.
Be on the look out pirates.
Happy sailing the high seas.
f.society, f.police, f.govt, f.politicians.
Snake Plissken signing out!
Peace.

ETH/BTC could be bottoming out and setting up for a huge runThe ETH/BTC price is following a very structured path. It bottoms before the bitcoin halving and then goes on a bull run. It's also formed a triangle which could now be tested on the downside. If it bounces it could lead to a very strong rally. The monthly stoch RSI is also in a bottoming formation.

The eth shocker!!I dunno. seems like a long ass accumulation.. what for? a mega pump? not before some serious pain and fud imo

GOOD LUCK ON ALTSWe'll have altbtc bottom here.
altusd will maybe drop 10-20% while btc stays still.
or
altusd stays still while btc gains 10%

Will Ethereum dominate?I've been talking about possible macro bullishness of ETHBTC for some time. My confidence has increased since then. I think this chart is about to prove its bullishness.
So here is the idea with better graphics now.
How is this going to interact with ETHUSD?
Honestly, I can't provide a great theory since the dollar pair is just "number go up" atm. Is a blow-off top possible? Will the ATH be a macro resistance? I don't know. Never underestimate the craziness of crypto.

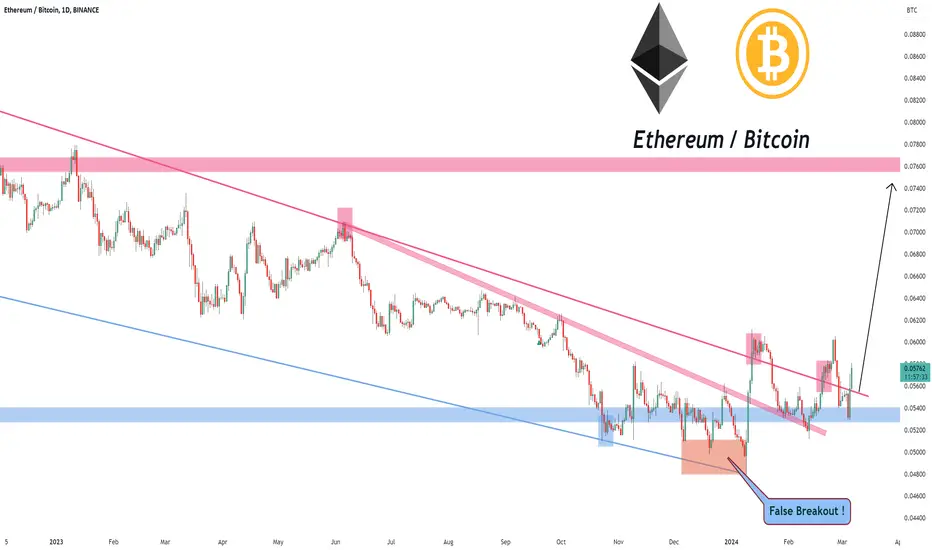
Ethereum / Bitcoin: what is the best short term choice?A local uptrend is replacing a long downward trend for the Ethereum/ Bitcoin chart.

#ETHBTC elliot waveThere are two possibilities for the direction of Ethereum against Bitcoin. The first is that it is an ascending five-point wave from a larger ascending five-point wave, or that it is a fourth ascending corrective wave from a larger bearish wave.
BINANCE:ETHBTC

Ethereum can strengthen against BitcoinThere are many new developments in the Ethereum ecosystem, but to summarize, EIP-4337, EIP-4844, L2 layers are expanding and increasing in number, leading many L1 networks to pivot to L2 Ethereum chains.

ETH-BTC Ethereum Elliott and Fibonacci structureThis study shows the Ethereum market against Bitcoin in terms of Elliott waves on a grid of Fibonacci trend lines generated from major price points of the market.
This highlights the distinctive triangular structure of trading for several years after the initial impulse of Ether to a Cycle high price.
Ever since printing the initial Cycle wave I, it has traded in a corrective pattern of a running flat with consistent internal 3-3-3 composition (ABC).

ETHBTC updateIt looks like the body of candles broke and closed the last level. Also, it looks like the next entry point for a buy for both ETHBTC would be where the impulse cleared liq. which lines up perfectly with the beginning of 2024. We'll see if its a bullish year for crypto. BUT it could also buy up hard and then dump hard to continue the bearish cycle.

ETH TO PUSH FOR TOP OF RANGE? Note the RSI breakout and retest.
Will this give Eth a shot at the upper range of the channel? Real question is will it break up or fail at the upper range? We’ll let the fans decide.
Good luck to all

There are signs of the end bullish trend in the Bitcoin Dominanc
There are signs of the end of the bullish trend in the Bitcoin Dominance Index
We convert a lot of bitcoins to some altcoins
We bought Ethereum ETHUSDT on the low - but the possibility of Ethereum becoming more bullish than Bitcoin is increasing
What are these signals based on?
Classical Technical Analysis
Price Action Candlesticks Fibonacci
RSI, Moving Average , Ichimoku , Bollinger Bands
Risk Warning
Trading Forex, CFDs, Crypto, Futures, and Stocks involve a risk of loss. Please consider carefully if such trading is appropriate for you. Past performance is not indicative of future results.
If you liked our ideas, please support us with your likes 👍 and comments .
ETH will outperform BTC
ETH/BTC pair forms a typical Accumulation schematic, following Wyckoff method.
In my analysis, it seems that ETH/BTC has likely reached its lowest point as the Spring event in phase C nears completion, paving the way for phase D and a potential acceleration to the upside. The primary obstacle seems to be the local trendline, but this shouldn't pose a significant challenge.
From a long-term perspective, I believe investing in ETH holds greater profit potential compared to BTC. However, this doesn't imply that an all-in approach on ETH is advisable. Diversification remains crucial in any investment strategy.
Disclaimer:
This analysis is based on my personnal views and is not a financial advice. Risk is under your control.

ETHBTC: Long opportunity may be looming.(Monthly chart) ETHBTC may have significative upside, up to 0.08+.
It may break up or grab more some more liquidity around the 0.05 mark (lower bound of BB).
Either way, i see more upside than downside. Two possibile Long entry points: on confirmed resistance breakout and/or on weakness through scattered orders in green support area.
Keep in mind this is a MONTHLY chart, hence this is a long term analysis.
Chart image (Since Tradingview usually messes the chart):
Summary:
Close to resistance
Red TD count 8
CMF approacing zero, rising.
RSI rising.
Stoch RSI oversold, rising.
MACD flattening
Lower BB flattening close to 0.05
