Could be a bearish scenario here's an analysis that might indicate a bearish scenario:
1. **Rising Wedge Pattern**: The chart displays a rising wedge pattern, which is often interpreted as a bearish signal in technical analysis. This pattern suggests that despite the uptrend, the market could be losing momentum and a reversal to the downside may occur.
2. **Price Action**: The current price of Ethereum is noted at **3148.80 USDT**. If this price is near the resistance line of the wedge pattern, it could suggest that a downward movement is likely.
3. **EMA Indicators**: The presence of EMA 20 and EMA 9 on the chart can serve as dynamic support and resistance levels. A bearish indication would be if the price starts to fall below these EMAs, especially if the shorter period EMA (9) crosses below the longer period EMA (20).
4. **Volume**: While the volume details are not clear, typically, for a rising wedge pattern, if the volume is declining as the price ascends, it can be a confirmation of the bearish pattern, indicating a lack of buying interest at higher price levels.
It's important to remember that while technical analysis can provide insights, it's not foolproof. Market conditions, news, and other external factors can influence price movements. Always consider a comprehensive approach to trading, including risk management strategies like stop-loss orders to protect your investments.
ETHDOWNUSDT trade ideas

ETH updateETH - a very short time frame chart!
So, those levels/zones above represent Targets, but step-by-step. I.e. to reach the next one we need to be adobe previous.

#ETH forming this massive falling wedge!Taking a look at the #Ethereum daily timeframe, we are still potentially forming this massive falling wedge pattern because as of right now, the price has not yet confirmed the break either below the line or above its resistance line. The line of support is sitting at around 2890, so also right around that 2.9K level, which is an important level on the chart, and this resistance is sitting at around 3K, which is the level we need to confirm a breakout above in order to confirm the bullish price target for this pattern.
Stay tuned for updates.
#cryptocurrency CRYPTOCAP:ETH BINANCE:ETHUSDT

ETH longFVG Into AOI and FVG out, showing bull signal.
Will close trade if there is no continuing bullish FVG.

Trading Ideas Results for March-AprilThis year I started sharing my analytical reviews and trading ideas since mid-March. I like using TradingView because here you can't edit or delete a published idea. Everything that has been published can be found and verified, which is not always possible on other platforms, for example, in Telegram channels where the administrator can adjust the statistics.
It's time to summarize the interim results of trading ideas from mid-March to April 30. In this review, I will only consider short-term ideas on the daily and hourly timeframes. Medium-term ideas on the weekly and daily timeframes will be analyzed in a separate review.
There were 4 short-term ideas. All of them are on the chart attached to this post. One for buying and three for selling. The results are also visible on the chart, and they are 100%, all targets were achieved. You can find more details about the ideas by following the links below (see related ideas). But was everything so good? Unfortunately, no, if we look more closely at how the price moved in each idea.
For AVAX, the selling time was chosen perfectly. Without any drawdown (2%), the price reached the target: +29%.
For ETH, I waited for the price to return to the range of 3200-3400 for buying, the drawdown after buying reached up to 3%, and the achieved target was +12%.
For SOL, the idea was to sell, and the drawdown on the trade reached up to half of the target (4%), but then the target was achieved with a gain of +11%.
For ORDI, a less favorable moment was chosen for selling compared to other ideas, resulting in a drawdown of 23%, which is comparable to the achieved final target of +24%.
It is worth noting that ORDI's market capitalization is 15 times smaller than AVAX's. Could this be the difference? What is an acceptable drawdown percentage for you before the idea works out? Share your thoughts in the comments.
By the way, as part of the educational article on March 31, I made a short-term forecast for OPUSDT. Interestingly, it also worked out. Without any drawdown, the target was achieved: +29%.
I will publish the interim results of medium-term ideas in a separate review.


ETH 8H analysis - May 04 2024ETH is forming a contracting pattern. as the leader of Altcoins, once it breaks out of the pattern, many other coins will follow ETH and we'll probably be seeing some good pumps in alts

DAY TRADE - LONG - RISK ENTRY The market is lateralizing in a microestructure and below it there is an order block from a failed previous CHoCH. Its worth going in without waiting for a new CHoCH in this zone. RISK ENTRY.

#ETH/USDT Bullish above this MA...#ETHUSDT appears to be forming a bull flag pattern.
A bullish signal will confirm if we see a close above the blue 75 EMA and a breakout from the flag.
Until then, consider this a retest of the dotted trendline.
Let's wait for the weekly candle to close for more clarity, as the 75 EMA has proven quite reliable on the daily chart!
NFA, DYOR!
Please hit the like button as it helps me and my team to stay motivated and keep posting such important updates for free.
Thank you
PEACE

Lingrid | ETHUSDT potential BREAKOUT of the channelThe price perfectly fulfilled my previous idea. It hit the target level. As we can see, BINANCE:ETHUSDT is moving sideways in the giant range zone. The price took liquidity below the April low, forming a fake breakout of the strong support level. It broke and closed above the key level at 3000. I think the price might pull back to the support level, then move higher and keep making HLs. A breakout of the downward trendline is going to be a bullish sign, and we expect the price to retest the recent March highs. My target is the previous resistance zone at 3350.00
Traders, if you liked this idea or if you have your own opinion about it, write in the comments. I will be glad 👩💻

ETH short ALL trading ideas have entry point + stop loss + take profit + Risk level.
hello Traders, here is the full analysis for this pair, let me know in the comment section below if you have any questions, the entry will be taken only if all rules of the strategies will be satisfied. I suggest you keep this pair on your watchlist and see if the rules of your strategy are satisfied. Please also refer to the Important Risk Notice linked below.
Disclaimer

ETHERUEM → ETH is ready for an upwardhello everyone...
as you can see the coin hunted from both sides in this situation I am with the first hunted area so I am into the bullish trend for this coin.
on the other hand, the price touched the bottom line of the channel and is starting an upward movement from there and rejected the breaking idea.
___________________________
✓✓✓ always do your research.
❒❒❒ If you have any questions, you can write them in the comments below, and I will answer them.
❤︎ ❤︎ ❤︎And please don't forget to support this idea with your likes and comment

ETH - 2700$ key support, will it hold?Keeping this one short, simple and stupid.
Think we won't see a real move until monthly close, I expect another drop around monthly open into key support around 2700$, think there is a high chance it will hold. Key level to break would be 3400$, but this would just be the first step. If we see 3800$ break with momentum, we should target ATH within few days. From there we shall see. Still convinced we see 10k ETH in the future, most likely this year.
Stay safe.
Sell ETHUSDT Bearish PennantThe ETH/USDT (Ethereum) pair on the M30 timeframe presents a potential shorting opportunity due to the presence of a bearish pennant patten.
Potential Short Trade :
Entry: Consider entering a short position (selling) below the broken support trendline of the pennant after confirmation. Ideally, this would be around 3020 or lower if the price continues to decline.
Target Levels:
2764: This target is achieved by measuring the height of the flagpole (initial downtrend before the pennant) and projecting it downwards from the breakout point.
2692: This is a further extension of the downside target, based on roughly twice the height of the flagpole.
Stop-Loss: Once the entry point is confirmed, place a stop-loss order above the broken support line of the pennant, ideally with some buffer around 3040. This helps limit potential losses if the price unexpectedly reverses and breaks back upwards.
Thank you.

$ETH entry after strong 15m liquidationExpecting a bearish reaction in Daily supply after 15m strong liquidation and bearish momentum

Analysis for the etherum for short.. hello traders,
here's some view or analysis for etherum for the downside .
if you not follow my page you miss many trades..

Maybe you need this signal!From the chart, ETHUSDT has formed a bearish pattern without diverging, which indicates that the bearish trend will continue.

$ETH WHITE -SWAN BULLISH CONTINUATIONA bullish white-swan on #ETHUSDT showing trend continuation to the upside.
Strong support around $2300-$2400zone

ETH Slightly Bullish 24-Hours ☀, Bearish ☁️ & Downside Next WeekIn the US, there were outflows from the spot Bitcoin exchange traded funds (ETFs) for the sixth consecutive day. “We have seen six consecutive days of outflows, and as the average entry price ($57,300) approaches the current spot price ($59,800), we will likely see more ETF unwinding. Since March 18, the ETFs have seen outflows on 58% of all trading days,” 10x Research said in its daily note.
“This will likely lower prices to our target levels and cause a -25% to -29% correction from the $73,000 top - hence our price target of $52,000/$55,000 during the last three weeks,” the crypto research company forecasts.
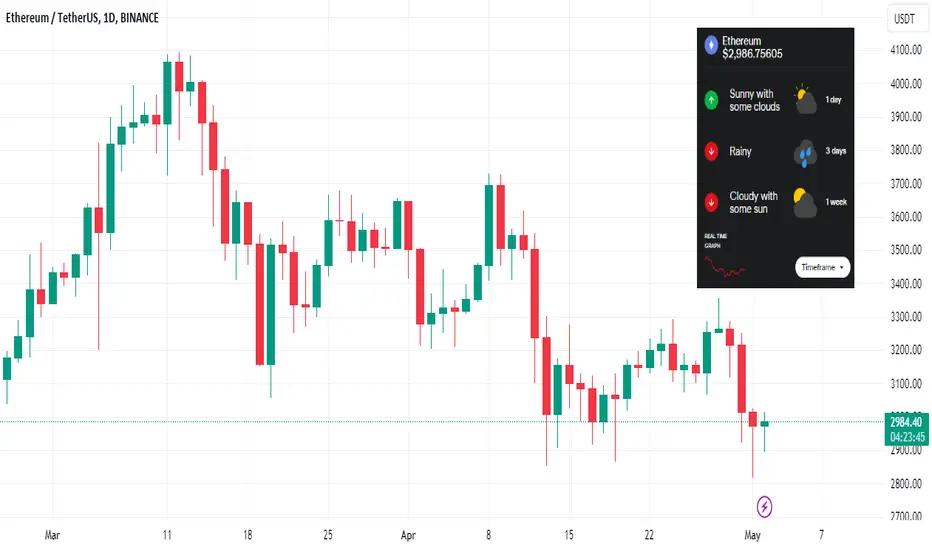
In Hong Kong, the first trading day of the spot Bitcoin and ETH ETFs approved proved to be a cold shower with only $12 million flowing into these new ETFs. Analysts had expected up to $300 million. The price of Ether fell 2.5 percent to $2,918 over the past 24 hours.
A slightly bullish sun shines over Ethereum and ATTMO signals a potential upside over the next 24 hours. Over a one-week horizon, bearish clouds are likely to sweep over most of the cryptoverse putting pressure on Ethereum, indicating a potential price drop.
Follow us for more crypto news and weather reports!
ETHEREUM / ETHUSDTGood Luck >>
• Warning •
Any deal I share does not mean that I am forcing you to enter into it, you enter in with your full risk, because I'll not gain any profits with you in the end.
The risk management of the position must comply with the stop loss.
(I am not sharing financial or investment advice, you should do your own research for your money.)

ETH - locally looks bullish. Key level - 3023.24.I expect to see a rise to 3023.24 in the near future. This is the start of a fresh daily fair value gap.

ETH target 4700 (perp)4h time frame
-
TP: $4616~$4890
SL: $2575
-
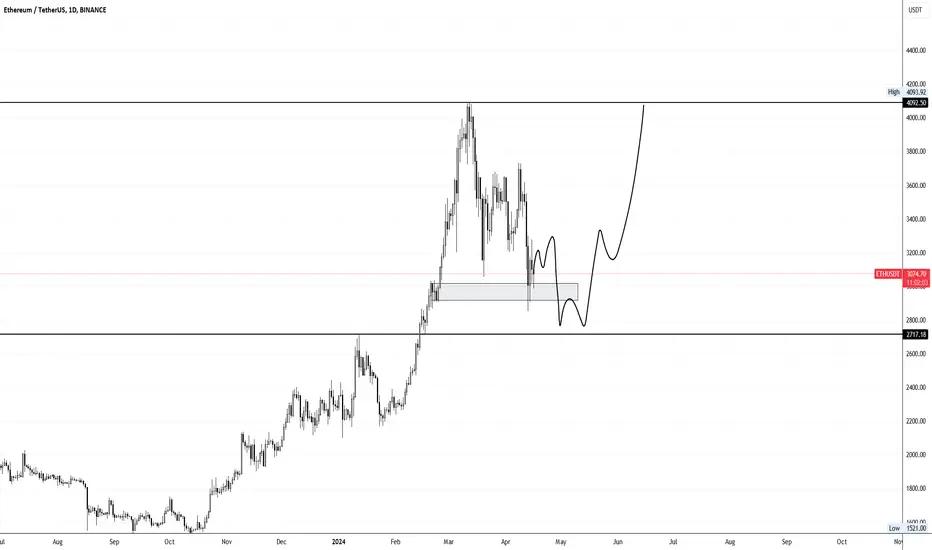
ETH is creating a potential wedge structure, that hasn't been confirmed yet. A standard structure is made of 6 six touching points at least, it's not completed due to lack of one more point on the wedge top. Also, there are two paths if we consider it as a continuation patter, first is the green one, that leave $2817 as the last low and keep going up, second is the red path, which make another low to build a robust bottom before pumping.
No matter what scenarios, they can reclaim $4800 in future if sustain continuation of the bull trend since $2171.

📉🔍 ETH Trading Analysis 🔍📈Market Observation:
Yesterday's significant dip brought many altcoins, including ETH, into their support zones.
Trade Setup:
Entry: Long spot position between $2,850 - $3,050.
Take Profit: $3,400 - $3,700 or $4,100 - $4,350.
Stop Loss: Just below $2,800.
Risk Management:
Implement a stop loss just below $2,800 to mitigate potential losses.
📈💡 Trade Strategy Rationale:
Anticipate a bullish move in ETH from the support zone, targeting potential profit levels as indicated.
📊🔄 Stay updated on market conditions for trade adjustments! #ETHTrading #CryptoAnalysis 🌐🚀
