Ethereum / Bitcoin
You cannot really short ETHJPY, but you can sell some ETH for JPY and aim to buy back more ETH on the reverse signal.
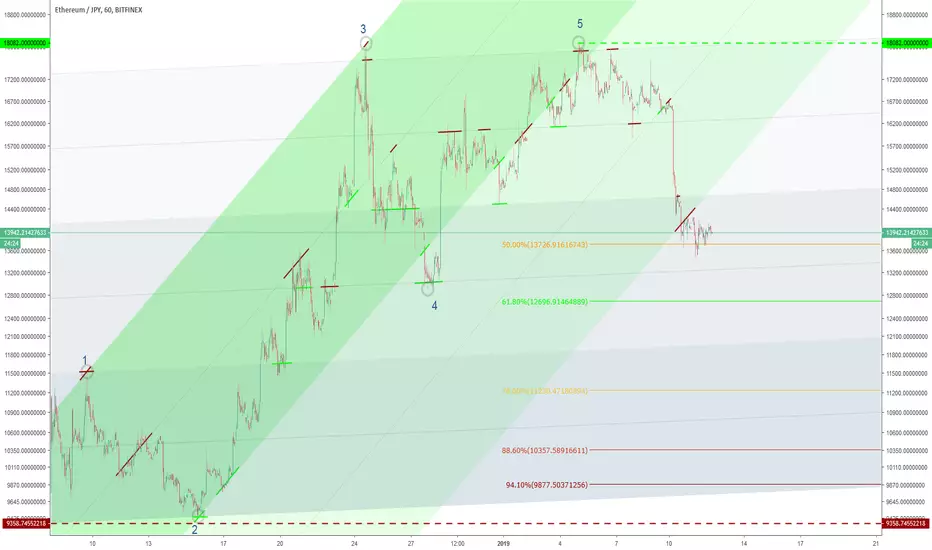
Seems like the entire crypto market is in heavy correlation. This is ETHEREUM INDEX! Find similiar structure on ETHUSD chart and trade accordingly. Same structures on BTCUSD, XRPUSD and ETHUSD. So all this applies to BTC as well. At any case, we have enough DM qualifiers to define this as VALID and GOOD breakdown. Max where price can go it is descending...
This pair has the best structure for EW and KC analysis. Base channel shown in Blue and Acceleration channel shown in Green (with adjacent shadow channels). Green and Red lines illustrate energy barriers (dynamic support and resistance offered by the growth structure) offering support from above (Green) and resistance from below (Red).
Despite what people may think, three-drives are actually a reversal pattern. Although this initially looks bearish, and it is, it's safer to trade it upon confirmation. Once completed, three drives indicate exhaustion of a trend, and can be played similarly to most other harmonic patterns. What we look for is three consecutive price swings in the same direction,...
Wanted to post this quickly for tracking purposes. I mentioned this potential inverse head and shoulders play in my post on Bitcoin earlier this morning. I'm curious to see how this plays out given the current juxtaposition of price relative to the pitchfork channel. Historically, I would think 61.8% retrace, but the PF is saying 38.2%. *NOT TRADING ADVICE*
This is just a quick post to track ETH's price movement. We have bounced cleanly of the 1.272 fib channel line of the Andrews Pitchfork. If we are going to find a bottom anytime soon, this would be it. I will try to post a more in-depth analysis later.
Here is an alternative harmonic that could be playing out for ETHUSD. This would have our target be around $1,250-$1,300, which is another level I was targeting yesterday. Then downwards to the 0.618, 1.272 and 1.618 of the AD leg, etc. *THIS IS NOT TRADING ADVICE*
Setup 1st Bollinger Band (BB) default deviation (dev.) 2 2nd BB dev. 1 Upper Range ( UR -7.79% ) is space between the upper dev. 1 and 2 bands Upper Mid Range (UMR) is space between 20ma and upper dev. 1 band Lower Mid Range (LMR) is space between 20ma and lower dev. 1 band Lower Range (LR) is space between the lower dev. 1 and 2 bands Trade 1 - Green...