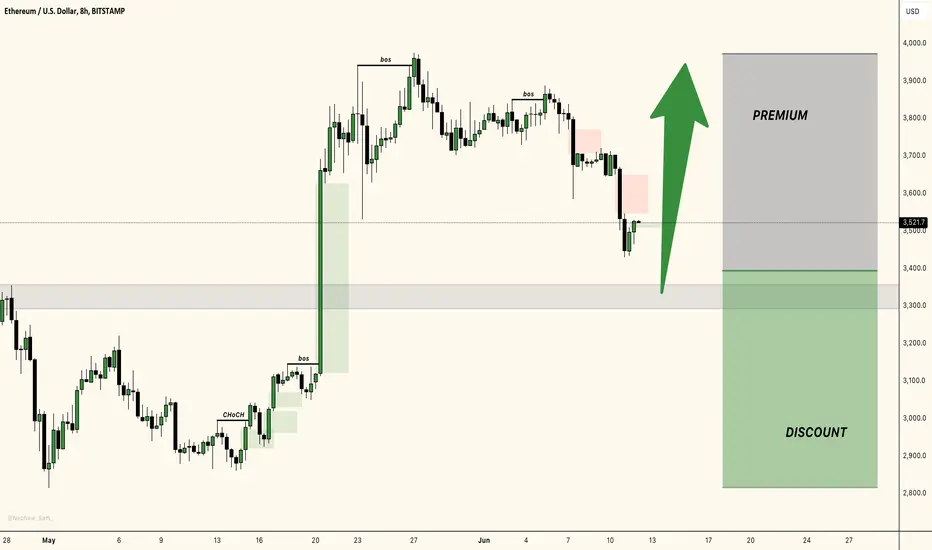
ETH, watch out for this MANIPULATION! We're now in the zone I was expecting!
I'm a buyer on ETH.
I think we are currently on the AMD setup (Accumulation-Manipulation-Distribution).
ETHUSD trade ideas
Ethereum is approaching a significant support areaHey Traders, in today's trading session we are monitoring ETHUSDT for a buying opportunity around 3,100 zone, Ethereum is trading in an uptrend and currently is in a correction phase in which it is approaching the trend at 3,100 support and resistance area.
Trade safe, Joe.

Eth- good buying pricesAfter a month-long consolidation near its peak, ETH plunged sharply, reaching a low of 3380 yesterday.
Despite this drop, the medium-term bullish trend remains intact and this decline should be seen as an opportunity to buy at more favorable prices.
My strategy is to buy on dips, anticipating a break above 4000.

Bitcoin has a strong bearish momentum, could it fall further?Price is rising towards a resistance level which is a pullback resistance and could potentially reverse from this level to our take profit.
Entry: 3,560.84
Why we like it:
There is a pullback resistance level.
Stop loss: 3,722.13
Why we like it:
There is an overlap resistance level which aligns with the 61.8% Fibonacci retracement.
Take profit: 3,350.20
Why we like it:
There is a pullback support level.
Please be advised that the information presented on TradingView is provided to Vantage (‘Vantage Global Limited’, ‘we’) by a third-party provider (‘Everest Fortune Group’). Please be reminded that you are solely responsible for the trading decisions on your account. There is a very high degree of risk involved in trading. Any information and/or content is intended entirely for research, educational and informational purposes only and does not constitute investment or consultation advice or investment strategy. The information is not tailored to the investment needs of any specific person and therefore does not involve a consideration of any of the investment objectives, financial situation or needs of any viewer that may receive it. Kindly also note that past performance is not a reliable indicator of future results. Actual results may differ materially from those anticipated in forward-looking or past performance statements. We assume no liability as to the accuracy or completeness of any of the information and/or content provided herein and the Company cannot be held responsible for any omission, mistake nor for any loss or damage including without limitation to any loss of profit which may arise from reliance on any information supplied by Everest Fortune Group.

selling opportunity for Ethereum against the US Dollar (ETHUSD) selling opportunity for Ethereum against the US Dollar (ETHUSD) at the current price of 3559.03. It's recommended to consider initiating a sell position at this level.
Additionally, it's advisable to set take-profit levels at 3510.01 and 3440.05 to secure potential gains in case of price declines.
To manage risk, a stop-loss order is suggested at 3590.05 to limit potential losses in case the market moves against the position.

ETHEREUM - HEAD AND SHOULDERS Hello Traders !
The Ethereum failed to create a new higher high !
The price formed a head and shoulders pattern.
Let's expect the bearish scenario:
if the market breaks the neckline and closes below that,
We will see a huge bearish move📉
__________
TARGET: 3015.00🎯

A potential targets for up coming bullish trendBitcoin has been lately consulted very much, which means we are having a correction.
Ethereum did break the downtrend and has a possible new high target around 5 000 $ . It is still very important that ethereum breaks the important key level otherwise the curtain situation is uncertain.
Six days before ethereum had a good climb. Bitcoin did break a similar flag in the (day) chart. Bitcoin has now a great new target of around 100 000 $.
Creed and fear index is at 56, which is neutral (12.6.2024) according to CoinMarketCap.com studies. That means there is plenty of room for the price to rise before people are greedy. Extreme creed leads to people overpaying and the market will probably make a correction.
(hope the charts are working, because I'm having a hard time while fighting them. Please correct me, if something is obviously wrong, I just wanna learn more.)

ETH, bullish continuation at support confluenceHello everyone,
unfortunately the breakout out of the flag was not able to break the intermediate high again.
The price broke down to the last point of control. I see a high confluence of support in this area.
According to the most likely elliot wave count a wave 5 of wave 3 is about to start.
Let's see what will happen.

ETHUSD LONG AHEADThe instrument has been trading inside a falling channel. It is currently testing a key support zone. If the price breaks below this zone, it may go further down to test the border of the channel. From these areas, I'll be looking for local long orders.
Please do your own analysis before placing any trades.
Cheers and happy trading.

ETHUSDT MARKET DOWN TREND MOMETUM It sounds like you're describing the price movement of Ethereum (ETH) against Tether (USDT) on a market. Here's a breakdown of your statement:
Starting Point: ETH/USDT market started at 3500.00 USDT.
First Target: The price reached 3400.00 USDT.
Second Target: The price then dropped to 3300.00 USDT.
From this information, it seems Ethereum (ETH) experienced a downtrend, where it first declined from 3500.00 USDT to 3400.00 USDT, and then further down to 3300.00 USDT.
If you're considering trading or analyzing the market, it's important to keep monitoring the price movements and consider various factors that could influence Ethereum's price, such as market sentiment, news, and broader cryptocurrency trends.
TRADERS IF YOU LIKE THIS CHART SO MUST SHARE YOUR OPNION HERE

Potential bullish rise?ETH/USD is currently reacting off a support level which is a pullback support and could rise to our take profit.
Entry: 3,441.08
Why we like it:
There is a pullback support level.
Stop loss: 3,331.30
Why we like it:
There is a pullback support level which aligns with the 136.2% Fibonacci extension.
Take profit: 3,661.18
Why we like it:
There is an overlap resistance level which aligns with the 50% Fibonacci retracement.
Please be advised that the information presented on TradingView is provided to Vantage (‘Vantage Global Limited’, ‘we’) by a third-party provider (‘Everest Fortune Group’). Please be reminded that you are solely responsible for the trading decisions on your account. There is a very high degree of risk involved in trading. Any information and/or content is intended entirely for research, educational and informational purposes only and does not constitute investment or consultation advice or investment strategy. The information is not tailored to the investment needs of any specific person and therefore does not involve a consideration of any of the investment objectives, financial situation or needs of any viewer that may receive it. Kindly also note that past performance is not a reliable indicator of future results. Actual results may differ materially from those anticipated in forward-looking or past performance statements. We assume no liability as to the accuracy or completeness of any of the information and/or content provided herein and the Company cannot be held responsible for any omission, mistake nor for any loss or damage including without limitation to any loss of profit which may arise from reliance on any information supplied by Everest Fortune Group.

Bearish drop?Ethereum (ETH/USD) is currently reacting off the pivot which has been identified as an overlap resistance and could drop to the pullback support.
Pivot: 3,628.53
1st Support: 3,402.67
1st Resistance: 3,758.68
Risk Warning:
Trading Forex and CFDs carries a high level of risk to your capital and you should only trade with money you can afford to lose. Trading Forex and CFDs may not be suitable for all investors, so please ensure that you fully understand the risks involved and seek independent advice if necessary.
Disclaimer:
The above opinions given constitute general market commentary, and do not constitute the opinion or advice of IC Markets or any form of personal or investment advice.
Any opinions, news, research, analyses, prices, other information, or links to third-party sites contained on this website are provided on an "as-is" basis, are intended only to be informative, is not an advice nor a recommendation, nor research, or a record of our trading prices, or an offer of, or solicitation for a transaction in any financial instrument and thus should not be treated as such. The information provided does not involve any specific investment objectives, financial situation and needs of any specific person who may receive it. Please be aware, that past performance is not a reliable indicator of future performance and/or results. Past Performance or Forward-looking scenarios based upon the reasonable beliefs of the third-party provider are not a guarantee of future performance. Actual results may differ materially from those anticipated in forward-looking or past performance statements. IC Markets makes no representation or warranty and assumes no liability as to the accuracy or completeness of the information provided, nor any loss arising from any investment based on a recommendation, forecast or any information supplied by any third-party.

Falling towards a pullback support, could it bounce from here?Ethereum (ETH/USD) is falling towards the pivot which acts as a pullback support and could potentially bounce to the overlap resistance.
Pivot: 3,442.46
1st Support: 3,323.12
1st Resistance: 3,657.27
Risk Warning:
Trading Forex and CFDs carries a high level of risk to your capital and you should only trade with money you can afford to lose. Trading Forex and CFDs may not be suitable for all investors, so please ensure that you fully understand the risks involved and seek independent advice if necessary.
Disclaimer:
The above opinions given constitute general market commentary, and do not constitute the opinion or advice of IC Markets or any form of personal or investment advice.
Any opinions, news, research, analyses, prices, other information, or links to third-party sites contained on this website are provided on an "as-is" basis, are intended only to be informative, is not an advice nor a recommendation, nor research, or a record of our trading prices, or an offer of, or solicitation for a transaction in any financial instrument and thus should not be treated as such. The information provided does not involve any specific investment objectives, financial situation and needs of any specific person who may receive it. Please be aware, that past performance is not a reliable indicator of future performance and/or results. Past Performance or Forward-looking scenarios based upon the reasonable beliefs of the third-party provider are not a guarantee of future performance. Actual results may differ materially from those anticipated in forward-looking or past performance statements. IC Markets makes no representation or warranty and assumes no liability as to the accuracy or completeness of the information provided, nor any loss arising from any investment based on a recommendation, forecast or any information supplied by any third-party.

eth/usd potential breakout to ATHWe expect price action from the setup to reach the 3540-50 liquidity area and successfully rebound from the range. When this is confirmed, we are positive that the ATH will be reached somewhere near the 15 of July.

ETHUSD faces downside riskFrom the daily chart, we can see that ETHUSD encountered resistance and fell back after rebounding in the supply area, and the short-term bearish trend is dominant. At present, we can pay attention to the support near 3380. If it falls below, it is expected to establish a downward trend, and the downward target is expected to look at the 2860-3040 area.

💎ETHUSD: FULL Multitimeframe analysis💎A lot of bullish confluence at the moment for ETH
☝️Do not act based on my analysis, do your own research!!
Learn from my experience, with all the mistakes and pain shared on the way to the main goal - consistency. I'm always glad to discuss and answer questions.
⚠️ ALL videos and ideas here are for sharing my experience purposes only, not financial advice, NOT A SIGNAL. YOUR TRADES ARE YOUR COMPLETE RESPONSIBILITY. Everything here should be treated as a simulated, educational environment. DO NOT act based on my analysis, do your own research!!

Ethereum Long Term IdeaIdeally, would like to see ETH stay above 600s from here on out. Monthly chart, will update on lower weekly time frames as time progresses.

Ethereum will give you a Ferrari in the futureIn the big picture, extremely BULLISH!!!!!!
!In a small picture!:
MACD crossing down is very likely.
Because macd has failed crossing, which makes the next crossing more realistic.
Crossing down means BUY when the price is in red and there is no sign of green. Support points or resistances are required
Under 3000k soon. The landing level is not known today, only time will tell.
I could be wrong, but I could be absolutely right
MoralDisciple

$ETHETH looking good here , bullish structure on lower time frames, doji morning start on previous daily , am ullish here , with clear stop , risk to reward 4.78 to 1 ratio

Heading into 61.8% Fibonacci resistance?ETH/USD is rising towards a resistance level which is a pullback resistance that lines up with the 61.8% Fibonacci retracement and could reverse from this level to our take profit.
Entry: 3,706.15
Why we like it:
There is an overlap resistance level which lines up with the 61.8% Fibonacci retracement.
Stop loss: 3,882.49
Why we like it:
There is a pullback resistance level.
Take profit: 3,353.22
Why we like it:
There is an overlap support level.
Please be advised that the information presented on TradingView is provided to Vantage (‘Vantage Global Limited’, ‘we’) by a third-party provider (‘Everest Fortune Group’). Please be reminded that you are solely responsible for the trading decisions on your account. There is a very high degree of risk involved in trading. Any information and/or content is intended entirely for research, educational and informational purposes only and does not constitute investment or consultation advice or investment strategy. The information is not tailored to the investment needs of any specific person and therefore does not involve a consideration of any of the investment objectives, financial situation or needs of any viewer that may receive it. Kindly also note that past performance is not a reliable indicator of future results. Actual results may differ materially from those anticipated in forward-looking or past performance statements. We assume no liability as to the accuracy or completeness of any of the information and/or content provided herein and the Company cannot be held responsible for any omission, mistake nor for any loss or damage including without limitation to any loss of profit which may arise from reliance on any information supplied by Everest Fortune Group.

ETHUSD: The buyer's ready. Any chance of $4,000?ETH gives hope. Lately, there has been a high interest from investors in the coin.
As for 3360, there is a buyer who is ready to fight. On the weekly timeframe, a false breakout is forming and an encouraging long tail, which means that overall, the bulls are not ready to let the price go lower yet.
All eyes are on the resistance at 3675. If the resistance is not passed, the price will close in the range of 3350-3675 for some time.
But, the buyers may show persistence and in this case the price may head for a retest of 4000.
Strategy: A small correction may follow from 3676, but if the buyer starts to bring the price back to the level (retest), then we should expect a breakout of the level with further growth.

ETH base data A representation of the Ethereum price action, utilizing a unique combination of circles, a 45-degree angle, and tangents to uncover hidden patterns and symmetries.
The chart features multiple circles, each placed at significant points in the price history of ETH. These circles serve as markers for important support and resistance levels, as well as potential reversal points. By connecting these circles, we can visualize the underlying structure of the market and identify potential areas of interest.
To further enhance the analysis, a 45-degree angle has been applied to the chart. This angle, often considered a critical angle in technical analysis, helps to identify potential trend lines and channels. By aligning the price action along this angle, we can observe how the market has responded to specific levels and identify potential future price targets.
Additionally, the use of tangents has been employed to uncover hidden symmetries and alignments within the chart. By drawing tangents from key points on the circles, we can observe how the price action has interacted with these lines, revealing potential areas of support and resistance.
Overall, this tradingview chart represents a comprehensive and innovative approach to technical analysis, combining multiple techniques to provide a unique perspective on the Ethereum market. By utilizing circles, a 45-degree angle, and tangents, we can gain valuable insights into the underlying structure and potential future price movements of ETH."

ETHUSD - Bearish TrendETHUSD - Bearish Trend....Presently ETH at its trendline support, placing market execution (Sell)
