ETHUSDT Ready to break the significant barrier of 3000$ETH the second largest cryptocurrency has maintain its crucial 3000$ level and now moving towards 4000$. if it breaks through 3500 soon we will see the significance movement
ETHUSDT trade ideas

ETH may be a long for breakoutETHUSDT is recovering after a long consolidation. As BTCUSDT has grown substantially after a weak inflation publication yesterday, ETH is still lagging, and the spread between Bitcoin and Ether has reached the extremely "overbought" zone, pointing to a potential of a rotation to ETH from BTC.
Overall market conditions stay bullish, as inflation is declining: April was the first month of reduced US CPI reading.
The interest rate decline probability had increased for September this year, and yields of 30-year treasury bonds have crossed 4.5% from above.
That is a potentially bullish situation for stocks and cryptos.
Don't forget - these are just the ideas, always manage your risk and DYOR!

ETH BULLS TO TAKE OVERHello Traders and everyone, I am Hadi Karaali, Known as SNIPERS_FX
If you like the idea, do not forget to support with a like and follow.
ETH BULLS TO TAKE OVER. 📚
👉As we can see price was clearly overall bearish, Moreover, price recently got stuck inside this big range, Specifically trading inside this symmetrical triangle.
👉Meanwhile, from a short-term perspective, and for the bulls to take over, we need a break first above 3100, then expect a movement higher.
Adding on, From a medium-term perspective, and for the bulls to kick in for a new impulsive move, we need a break above the upper marked major swing high, Then a movement higher would be expected. 📚
If you like this kind of analysis don't forget to like and follow
and as usual follow your trading plan and manage your risk.
Be patient and good luck!

$$ETHUSDT UPDATE$$Dear Respected Traders, we hope this communication finds you well.
we are convening a discussion focused on #ETHUSDT
The Falling Wedge Pattern Formtion is Completed and Now it will go up
#Bitcoin #Crypto #Ethereum #Cryptocurrency #CryptoTrading #BTCUSDT #ETHUSDT #ALTCONS #USDT CRYPTOCAP:BTC CRYPTOCAP:ETH CRYPTOCAP:USDT

High chances of going up from my level..hello traders.,,
This is ethereum chart and its looking good for upside moves..
so mark my level for confirmation for your trade ....
high chances of profits..
and follow my page for next update

EthusdtWrestling with the 1daily ema here..
Order books are pretty stacked with puts tbh
Probably get another sweep before it pushes but other coins like sol are showing mega strength here with the btc breakout...
I doubt eth takes too long to catchup there given all the etf rumours
Midjune is predicted to be a market high so there's not much more time to dip here..

Eth short setup ALL trading ideas have entry point + stop loss + take profit + Risk level.
hello Traders, here is the full analysis for this pair, let me know in the comment section below if you have any questions, the entry will be taken only if all rules of the strategies will be satisfied. I suggest you keep this pair on your watchlist and see if the rules of your strategy are satisfied. Please also refer to the Important Risk Notice linked below.
Disclaimer

📈ETH: Identifying Key Entry Points in Futures Trading👑🔍Today is a crucial day for altcoins, as they have reached significant support levels. The market exhibits clear signs of buyer weakness, with selling volumes substantially outpacing buying volumes. Given these conditions, short positions are more favorable. The focus of today's analysis is Ethereum (ETH), the leading asset in the DeFi space that continues to attract a large number of enthusiasts. Let's examine potential entry points for ETH in futures trading.
🔄In the last analysis, I provided two triggers for positions—one long and one short. Both positions achieved their targets if closed early as advised, resulting in profitable trades. If you entered these positions, please share your experiences in the comments; it’s gratifying to see you profit from the provided triggers. If you missed these triggers, don't worry—there are always opportunities in the market. Pay close attention to the triggers I provide to avoid missing future movements and to secure profits.
📉The chart clearly shows a downtrend for ETH, with a descending triangle pattern indicating a potential move lower. The trigger for this triangle is the support at $2,880. If a candle closes below this level, we can expect the price to move down to the $2,614 area, providing a suitable target. Confirmation of this downward momentum can be reinforced by the RSI breaking below its support at 36.59. This would allow us to confidently maintain our short positions. The volume of the candles is also crucial, as increasing selling volume could lead to a sharper decline. Thus, this trigger offers a solid short position opportunity.
📈Despite the strong selling pressure, we should always prepare for multiple scenarios and avoid being surprised by market movements. Like a general with multiple battle plans, traders should anticipate various outcomes. Although I see a higher probability of a decline, I still consider potential long triggers. Given the strong downtrend and weak buyer momentum, I would enter a long position only if a candle stabilizes above $2,964. However, the risk for this position would be half of the usual, and I would close it quickly. A more reliable long trigger would be $3,283, which becomes logical if the SMA99 moves below the candles, removing a significant dynamic resistance.
📝In conclusion, Ethereum's current market conditions favor short positions due to a clear downtrend and significant selling pressure. The primary short trigger at $2,880 and target of $2,614 offer a promising setup. However, always prepare for alternative scenarios. For potential upward movements, consider long positions with a candle close above $2,964, but manage these positions with reduced risk and quick exits. The more robust long trigger at $3,283 could provide a safer entry as market dynamics change. Stay vigilant, manage your risks, and adapt to market movements to capitalize on trading opportunities.
🧠💼It's important to acknowledge the inherent risks in futures trading, with the potential for margin calls if risk management is neglected. Always adhere to strict capital management principles and utilize stop-loss orders, ensuring that the initial target offers a risk-to-reward ratio of 2.

ETH - Wait For The Bulls!Hello TradingView Family / Fellow Traders,
📦 ETH has been trading within a big range around the $2,800 - $3,000 support in the shape of a flat rising channel.
Currently, ETH is hovering around the lower bound of the support and rising channel.
As long as the $2,800 support level holds, we expect the bulls to kick in soon!
📈 For the bulls to take over and start the next bullish impulse movement, a break above the last major high in green at $3,000 is needed.
📚 Always follow your trading plan regarding entry, risk management, and trade management.
Good luck!
All Strategies Are Good; If Managed Properly!
~Richard Nasr

ETH Price Prediction and Elliott Wave AnalysisHello friends,
I hope to update you, Don't forget to follow/subscribe, and like my content.
Thanks, Bros

HelenP. I Ethereum can break support level and continue fallHi folks today I'm prepared for you Ethereum analytics. A not long time ago price some time traded in the resistance zone, which coincided with the resistance level, and later tried to rise, but failed and in a short time declined the lower 3150 level. After this, ETH rebounded up to the trend line and then made a strong impulse down to the support zone, breaking 3150 with 2900 levels. Soon, the price turned around and rebounded up from the support zone, breaking the 2900 level again and in a short time rose to the resistance level and even higher, reaching the trend line again. But ETH at once rebounded and declined to support level back, breaking resistance level one more. Ethereum some time traded near the 2900 support level and even tried to rise more, but failed and now continues to trades very lose to the support level. For my mind, Ethereum will make a small move up and then break the support level, after which continue to decline, therefore I set my goal at 2775 points. If you like my analytics you may support me with your like/comment ❤️

ETH priceThe second largest cryptocurrency, Ethereum (ETH) price has slipped below the round mark of $3000 and is eyeing to retest its 200 day EMA mark.

#ETH UPDATE On the weekly timeframe currently, the price is approaching a critical level on the chart, which is the 0.382% FIB support level just below $2.9K, specifically around $2860 to $2870. Suppose we confirm a break to the downside below that level, for example, with a weekly candle close well below it. In that case, the next major retracement level on the weekly timeframe is the 0.5% adjustment level, which is around $2.5K. $2.5K is also an important level on the chart based on previous resistance and support seen in the candle closes and back in Q1 of 2022. So, once again, $2.5K will be the next major price target to the downside if we confirm a break below $2.8K to $2.9K. In case you're wondering, below the 0.5% FIB level, we have the all-important golden pocket between $2000 and $2.1K, acting as strong support based on previous resistance and support levels.
If we take a look at the daily timeframe, we can see that in the short term, the price is still clearly trending upwards. However, when zooming out to the weekly timeframe, this short-term uptrend may just be a pullback within the larger bullish trend. So, whether we bounce here or at $2.5K, either way, this could be just a significant pullback within the larger bullish trend, similar to what we saw previously. For instance, the short-term bear trends seen here and here were followed by bounces off the support line at around $2850 and resistance around $3240.
Stay tuned for more updates.

Last chance buy ETH nowETH approach trendline D1
Waiting for react with trendline D1. If good, uptrend will start here.

ETHUSDT"Bullish diversion" typically refers to a situation in financial markets where there's a temporary divergence or distraction from the overall trend, but it ultimately leads to an upward movement in prices. This could occur when there's a short-term decline or sideways movement in the market amidst an overall bullish trend. Traders might interpret this diversion as an opportunity to buy, anticipating a continuation of the upward trend once the diversion subsides. It's like a detour on the road to higher prices.

📉📈 ETH Trade Analysis 🔄💼Trade Overview:
ETH's current support area has remained strong over the past week, presenting an opportunity to enter a long spot trade.
Trade Setup:
Entry: Ladder into the trade between $2,850 - $3,050.
Take Profit: Set profit targets at $3,400 - $3,700 and the next resistance area at $4,100 - $4,350.
Stop Loss: Place the stop loss just below $2,800 to manage risk effectively.
📊🔍 Monitor ETH's price movement closely and adjust trade strategy as needed! #ETHTrading #CryptoAnalysis 🌐🔒

ETHEREUM - Price can start to grow from support level in flatHi guys, this is my overview for ETHUSDT, feel free to check it and write your feedback in comments👊
Recently price entered to rising channel, where it rose to resistance level, which coincided with resistance area.
Then price broke this level and rose to resistance line of channel, after which it bounced and started to decline.
In a short time, ETH declined to support line of channel, breaking $3105 level again, and soon exited from rising channel too.
After this, price started to trades inside flat, where it some time traded near top part but later declined to support level.
Ethereum some time traded close to this level and then bounced up, but a not long time ago it fell back.
So, I think ETH can decline to support level and then bounce up to $3025 inside flat.
If this post is useful to you, you can support me with like/boost and advice in comments❤️


ETHUSDT LONG PROJECTION ✅✔️Price was in a mini downtrend from the LTF and is also in a demand level from the 4hrTF , so In 2hr price brokeout from trendline and retested which is a good entry for a buy....no confirmation, no entry 🚫

Ethereum intraday forecastThere's a bullish divergence on ethereum's daily here. However, theres a likelihood of a drop to the 2.6-2.5 area.
I would like to see eth hold that zone if it does drop there (will update in said event!).
I was in an eth trade and now i put my stop to B.E (4hourly looks bit bearish for me)
NOTE: I am overall bullish and i hope we go straight up from here. Just making this forecast to keep you updated.

Educationit may be the begininge of the bullish cycle , we did spot a good doble bottom on the weekly time frame on the trendline combined with good volume

ETH Ethereum falling wedge pattern If you haven`t sold ETH at the top:
As the cryptocurrency market navigates through choppy waters, Ethereum, the second-largest cryptocurrency by market capitalization, finds itself ensnared within a bearish formation known as a falling wedge pattern. This technical setup, coupled with broader market uncertainties, casts a shadow over Ethereum’s short-term prospects, with a looming price target of $2400 becoming increasingly probable.
A falling wedge pattern typically signals a continuation of a prevailing downtrend, suggesting that Ethereum’s recent struggles may persist in the near term. Characterized by a series of lower highs and lower lows, this pattern reflects a gradual erosion of bullish momentum, often culminating in a breakdown below the wedge’s lower boundary.

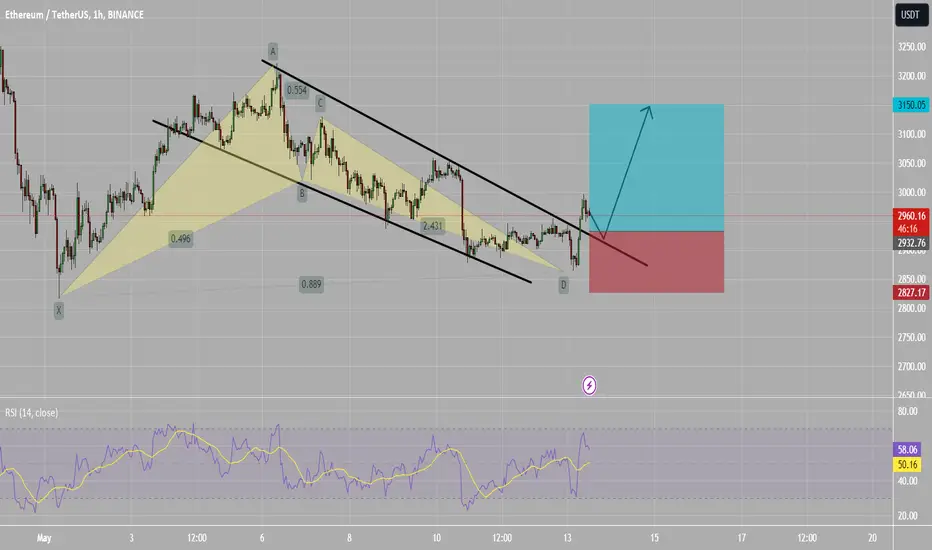
RR=2 Buy ideabullish bat pattern + RSI divergence + breakout of flag pattern ; expecting a pullback and a price to rise to 3150
PS never risk more than 2% of your capital per trade