Ethereum | Is the downward trend continuing?Ethereum has reached a resistance range and is still moving under a downward trend. Considering the failure to break this resistance, we expect a price decrease towards 3000 and even lower towards 2900.
ETHUSDT trade ideas

Ethereum can rebound up from support line of triangle to 3085Hello traders, I want share with you my opinion about Ethereum. Observing the chart, we can see that the price some time ago declined to the support level, which coincided with the buyer zone, after which rebounded and tried to grow but failed and declined to the support line, which is located in the buyer zone. Then ETH in a short time rose to the seller zone and even higher, breaking the resistance level, after which turned around and declined to the support line, breaking the 3200 level again. After this, ETH rebounded from the support line to 3355 points, turned around, and made a strong downward impulse inside the downward triangle. Price broke 3200 and 2950 levels and the support line also, after which it turned around from the support line of the triangle and started to grow. In a short time Ethereum rose to the resistance level again, breaking the support level one more time, but then it at once rebounded and fell to the buyer zone. Later price rebounded up from the buyer zone, making a fake breakout of the support level, and a not long time ago fell to the support line of the triangle. For this moment, I think that ETH can rebound from the support line to the resistance line of the triangle, therefore I set my target at 3085 points. Please share this idea with your friends and click Boost 🚀

Ethereum going to 2289 @ daily timeThe initial stages of Ethereum's decline to the price gap of 2966 occur within a fifteen-minute timeframe, but the drop to 2289 on a daily basis, considering Ichimoku Gap and its elements, is definite.

Ethereum's $3,000 Dilemma: Bullish Rejection, Bearish Break-Out?Indecisiveness persists in the intraday chart as Ethereum hovers around $2,992, an intraday support zone.
1. A bullish rejection of $2,992 with momentum could offer a scalping opportunity, targeting $3,166, $3,370, and possibly extending to $3,551.
2. Closing H4 candles below $2,992 raises the likelihood of a downside move towards $2,898 and $2,787.
3. Alternatively, a lack of momentum may result in sluggish, sideways price action between $2,992 and $3,166.
More details in signature!

ETHUSDTDear traders,
I have conducted an analysis of Ethereum coin, which many of you have in your wallets. Currently, there is a great opportunity for profit in this digital currency, and you can enter a buy trade considering the risk involved to reach your specified targets. The chart used is very simple and clear, requiring no further explanation. I wish you all success and profitability, and I am happy to have you here. If you need more information, I would be glad to assist. Thank you.
#Smart money concept
#Liquidity
#Hunter

Ethereum has a Good Bullish Sign!Hi.
BINANCE:ETHUSDT
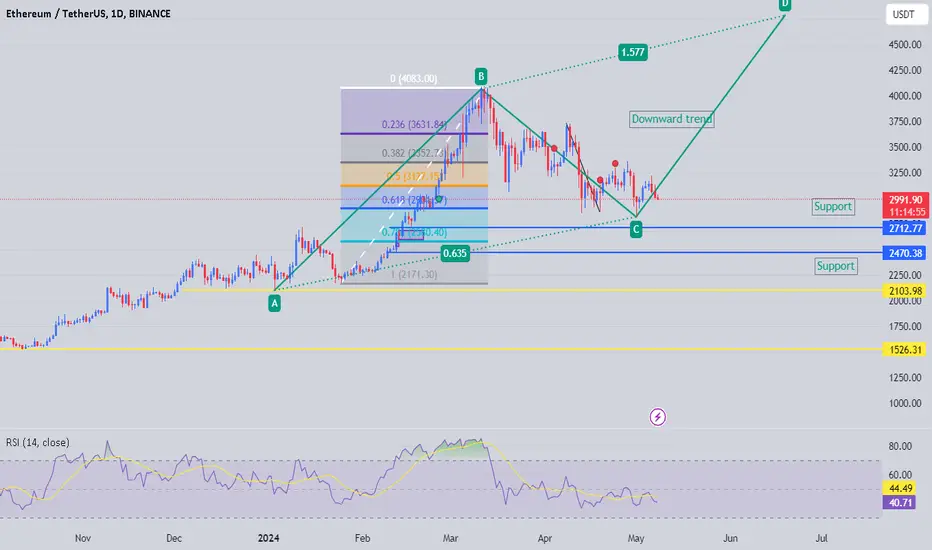
Today, I want to analyze ETH for you in a 1D time frame so that we can have a MID-term view of ETH regarding the technical analysis. (Please ✌️respectfully✌️share if you have a different opinion from me or other analysts).
➡️ETH has done a Impressive Movement recently but the odds of another bullish Movement is Pretty high because the pattern which ETH is in, Is a Bullish Flag Pattern! Since The break out has not happened, there is no confirmation of a Bullish Movement But If It happens, we Can Expect a Bullish Movement as much as the Measured Price movement (flag pole) to happen!
✅ Due to the Ascending structure of the chart...
🟢 ETH has been Bullish Recently!
🟢ETH is in a Bullish Flag
🟢(AB=CD)
🟢Price is gonna Reach $4100
Stay awesome my friends.
_ _ _ _ _ _ _ _ _ _ _ _ _ _ _ _ _ _ _ _ _ _ _ _ _ _ _ _ _ _ _ _ _
✅Thank you, and for more ideas, hit ❤️Like❤️ and 🌟Follow🌟!
⚠️Things can change...
The markets are always changing and even with all these signals, the market changes tend to be strong and fast!!


#ETHUSDT UPDATE! FORMING BULLISH PATTERN!!Hello everyone! If you enjoy this content, please consider giving it a thumbs up and following for more crypto updates.
Welcome to this ETH/USDT Quick Update!
The chart suggests a potential bullish continuation for ETH. It's currently consolidating within a falling wedge pattern, historically considered a bullish reversal sign. There's also good support around $2900-$3000 (green zone). If the price holds above this level, a breakout from the wedge could be imminent, potentially leading to new all-time highs (ATH).
Here's what could invalidate this bullish scenario:
A daily close below $2820.
What do you think about this? Let me know in the comments!

ETH scalp: Flip here and we'll get a nice setup.ETH is on a very strong support and volume is looking good, we can expect a nice bounce from here.

ETHUSDTAnticipate a consolidation phase preceding a significant downward trend reversal. Once the trend has shown signs of stabilizing, a break in the pattern could indicate a bullish market movement.

ETH/USDT is at $2982.00. The current selling zone for ETH/USDT is at $2982.00. It's an opportune moment to consider profit-taking strategies, with potential levels at $2914, $2880, and $2800. These levels offer strategic exit points to capitalize on market movements. However, it's crucial to implement risk management, with a stop loss set at $3089 to mitigate potential losses in case the market moves unfavorably. By strategically setting profit targets and employing a stop loss, traders can effectively manage their positions and optimize their returns in the volatile cryptocurrency market.

ETH///LONG///2800Hi. This is simple set up for a long, good buy zone 2800-2600. SL around 2200-2400.

Ethereum is undergoing correctionAt the point where we have placed a red arrow on the chart, Ethereum correction has started.
Ethereum seems to be forming a diametric pattern.
It can move from the specified Supply to the specified Demand.
On the Demand range, you can look for buy/long positions.
Closing a daily candle below the invalidation level will violate our buy/long view
For risk management, please don't forget stop loss and capital management
Comment if you have any questions
Thank You

ETH YOU CAN DECIDE NOW!Hello Traders and everyone, I am Hadi Karaali, Known as SNIPERS_FX
If you like the idea, do not forget to support with a like and follow.
ETH YOU CAN DECIDE NOW. 📚
👉As we can see price is still overall bullish from a long-term perspective, trading above our rising broadening wedge pattern, And till now price is respecting our 3k support zone.
👉Meanwhile, and as per my trading plan, I will be zooming into lower time frames to be looking for new longs around our support zone, to catch the next impulse movement.
👉Unless price managed to be breaking below our support zone and rising trendline, then expect a movement lower till the next rejection zone, then our falling correction channel will be extended! 📚
If you like this kind of analysis don't forget to like and follow
and as usual follow your trading plan and manage your risk.
Be patient and good luck!

ETHUSDTThe previous scenario is still valid and running, it is expected that in the monthly time the price will be corrected in the range of 2600 to 2540 and according to the movement scenario, it will have a profitable movement to the range of 3753-3918 dollars.

💎 ETHEREUM (ETH) - Investment Opportunity (READ THE CAPTION)Upon analyzing the #Ethereum chart on a weekly (logarithmic) timeframe, it is observed that the price had grown by 169% from October 20, 2023, to March 11, 2024, reaching $4090, before finally experiencing a drop and correcting down to the $3000 range. After a correction, it is likely that we will see Ethereum grow back to its previous high of $4850. The long-term targets for Ethereum, in order, are $5000, $5500, $6600, and $8500.
Please support me with your likes and comments to motivate me to share more analysis with you and share your opinion about the possible trend of this chart with me !
Best Regards , Arman Shaban

Eth/USDT keeps it down Scenario 1: Continued Downtrend:
if the MACD crossover is confirmed (blue line below orange line) and the RSI dips further below 40, it could indicate a continuation of the downtrend.
Potential support levels to watch: $2400 (previous low) and $2000 (psychological level).

✴️ Weekly Ethereum | New $12,744 All-Time High In 2025?There is something about these charts... Something about the candles, the bars, the dots, the points and figures... There is something about these symbols that speaks to me; do you read charts?
Isn't there a feeling involved in the chart reading process?
When you turn on your screen, phone/computer, and start to damage your eyes with the artificial light, don't you get the feeling that there is more than just logic and reason?
Can't you feel the market?
The market is not there, we only have the chart.
But right behind the chart is the market.
While the market is not part of the chart, the chart is definitely an intrinsic part of the market.
➖ The market draws the chart.
➖ The players print the candles.
➖ We buy and sell.
Everything we see happening on the chart is based on human action.
All of our human actions combined is the Cryptocurrency market we love and trade.
We are the Cryptocurrency market, and we as humans, we are all one.
Just as you can analyze your mind, your body and feelings, so you can analyze other people and their thoughts.
When looking at a chart, a strong spiritual connection can develop with the energies that are working behind the scenes to provide the information that we use and see.
So, while these are just candles and colors; financial hieroglyphs, codes; the energy that led to the production of these candles is the human force.
If you can dive deep into the chart, mentally, you can also gain access into the collective mind of all the traders that buy and sell; it is like seeing the behind the scenes of a chart.
Let's make an analogy: You see reality with your plain eyes and all is beautiful, all is great. You look at a drop of blood or semen and it is very interesting, new dimensions open up if you use a microscope or your third eye, you can see things that cannot be perceived with the naked eye, and so with the market is the same.
If you can dive deep into the chart, you can go behind the candles and read the markets energies and go beyond what the chart has to say.
When in doubt, meditate.
Meditation is good for trading and chart reading, you can improve your decisions making process, it can lead to better results, it can lead to more profits and to less stress.
I use meditation for charting and trading everyday.
If you meditate on the chart long enough, new possibilities develop and a market we once thought was bearish can turn to bullish in a matter of days.
When you take into consideration the market sentiment and the way other traders behave, it is easy to see that we are in a major transition point or else people wouldn't be this much at the edge.
They don't know they are at the edge, consciously, they only know subconsciously... They will know consciously only when the next drop comes and this will happen within days.
If you don't believe the chart; Sit back and relax, close your eyes and ask yourself... What will Ethereum do next?
What will happen next for Bitcoin and the Cryptocurrency market as a whole?
Then lay back and wait a few minutes... Don't force an image, don't force an answer, just let it play... You will be surprised. You will see/experience a vision, and whatever the vision shows up, it has nothing to do with what the chart has to say.
It is very interesting... Your vision can say up or down, but the chart says DOWN! And, down we go next!
Namaste.

#eth Ethereum has been rejected from the falling wedge resistan#eth
Ethereum has been rejected from the falling wedge resistance, along with the MA 100🧐
In case of a breakout of this pattern, the targets are $3,350, $3,730, and $4,050🎯
The main support zone is $3,000🔺

ETH-USDT Buy Setup using ADCD and Bullish Flag patternEthereum looks bearish for short period of time. The price will retrace in between .61 and .71 fib level.
Its also forming a bearish continuous flag pattern and there is no divergence in short time frame..
In a longer run I am still bullish its forming a nice bullish flag and can break an all time high in next few months
Ethereum chart overview for your next tradehello trader ,
here is your Ethereum chart analysis for your next trade
plan your trade accordingly ...to your view ..
and i will UPDATE on bitcoin soon..so follow the page for next update..

ethAs long as the red box is not broken, it can see any of the lower green lines. I think the market is a bit risky. Be careful.

