"Expert Tips for Selling Ethereum (ETH): Maximize Your Profits!"Topics Covered:
Understanding Market Trends
Timing Your Ethereum Sales
Risk Management Techniques
Maximizing Profits with Smart Trading Strategies
ETHUSDT trade ideas

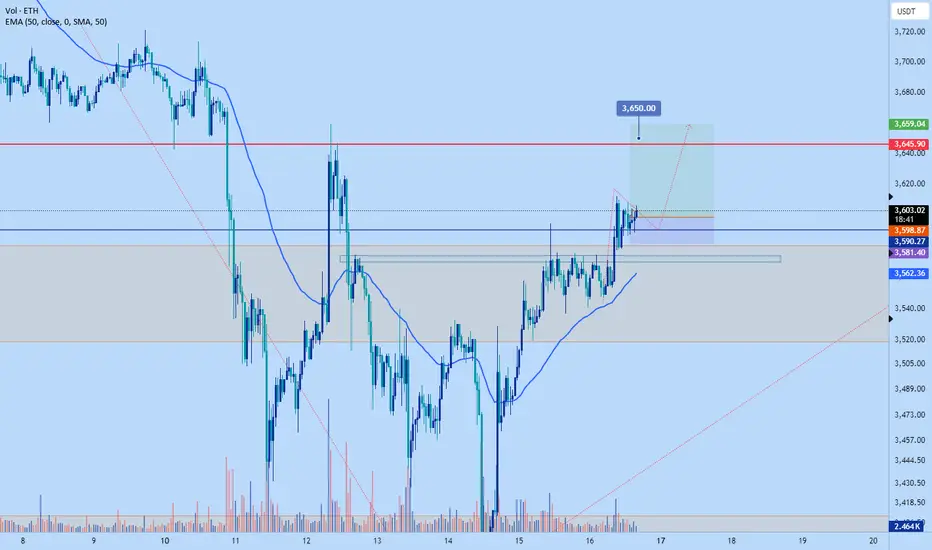
Eth to pump to $3650 by EODI'm anticipating Ethereum to make and impulsive push to close the week above $3650
Stop $3581 or lower
Target :$3650-$3660
Roughly 3 RR trade.
I trade price action, trends, support and resistance with confluences like volume, certain time of day, fibs and EMA . I don't have any fundamental theory as to why the price will go up or down other than demand being more than supply or vice versa.
Summer BreakoutETH weekly chart is tightening up as we approach the ETH ETF approval that is estimated to be July 2. Last time we based under ATHs (left side of chart), altcoins got wrecked similar to today, but what came next was the start of some wild moves in the crypto market.
Head up, time to focus.

This is ready to explode
How high can this go?
(IMO, Target = $ 10k)
Wave degree:
Primary: Wave 5 (larger degree),
Intermediate: Wave 3,
minor: Wave 3 (Impulsive rally),

#ETH head and shoulders structure is not established📊#ETH head and shoulders structure is not established❌
🧠Although we broke through the downward trend line, we still chose to fall in the end. The expectation of the bullish head and shoulders structure also failed, so the long orders we made based on this expectation were triggered to stop loss. Although it has fallen below the low again, we are currently in the buying zone. I will not chase shorts in this zone. Even if I want to go short, I have to wait for a rebound to occur before considering it.
➡️If we continue to fall, then we can just wait in the support area below. ☕️
Let’s see 👀
⚠️Don’t forget risk management⚠️
✔️Trade Security✔️
🤜If you like my analysis, please like 💖 and share 💬
💕 Follow me so you don't miss out on any signals and analyze 💯
BINANCE:ETHUSDT.P

ETH wait for 3000 for buy/longCMP the price at eth is going side ways incase the price starts making lower low and lower high on daily time frame, then follow the structure and wait for change of trend at the zone of 3000 where we have a order block and we can if we see impulsive move towards it will be target for 4250

ETHUSDT Short Position (June 22)Hello my friends.
In the 1-hour time frame, Ethereum has formed a suitable short stop that you can enter with confirmation

$ETH #Ethereum Trading IdeaETH/USD (Ethereum) price still holds on a $3,450-$3,500 support level. Waiting for a breakout like the last time. This bullish setup is invalid if this support won't hold the price. Then there is a huge probability of retesting the $2,920 support level. Be safe out there!

ETH ETH sweep the swing high (💀) to moving downside. Still ETH not create any trend reversel scenarios.
Order block (2) is next resistance zone and order block Order block (3) is support zone.

ETH 4h -ICTETH look a little more bullish than BTC. we bounced from a high probability area and created a mss but I don't like the price action, im waiting for more volatility and I want to see if the 4h breaker holds. if it does then I will look for longs

Is Ethereum Redirecting?📊 According to the buying pressure in the market, if the range of 3600 units is broken upwards and the price stabilizes above it, the price may increase to the range of 3680 units🎯, and in the case of the strength of the range of 3820 units🎯🎯.
📊 Otherwise, the price may drop to the range of 3400 units.

#ETH Where will the correction phase end? 📊#ETH Where will the correction phase end? ❓
🧠From a structural perspective, we have reached the target area of the double top bearish structure (3259-3429), so it is possible that we may end the correction from this area. If we can successfully break through turning point 1 or successfully break through the downward trend line, then this probability will be improved.
➡️From the perspective of wave theory, we are completing the correction wave C. The ideal interval for wave C to stop is 3051-3194🎯
Let's see 👀
⚠️Don’t forget risk management⚠️
✔️Trade Security✔️
🤜If you like my analysis, please like 💖 and share 💬
💕 Follow me so you don't miss out on any signals and analyze 💯
BINANCE:ETHUSDT.P


#ETH look for the false breakoutany false break out to the area of
2400-2500
will be a good buy sign with stop below 3200 and target 4300
trade safe and follow me 😉

Ethereum Price AnalysisETH is at $3,616.49 has struggled to sustain its position above the $3,669.57 support, showing that demand is declining at higher levels.
However, the upsloping 21-day EMA ($3,669.16) and the 55-day EMA ($3,478.51) indicate that the bulls are still in control. If the price rises from the current level and moves above $4,093.92, the price could rally to higher levels.
On the other hand, if the price breaks below the support zone in blue and 21-day EMA, it will suggest that the bulls have given up and are booking profits. That might push the pair down to the 55-day EMA ($3,478.51).

ETH [ BEARISH SWEET ZONE]We are expecting a massive drop of ETH , however this T.A time frame view is 1D do not expect that it will play as early , it will take time ; rest assured that if you are going to put a position manage strictly your risk reward ratio ; it may play out but it will grab some Liquidities before it will play out

ETH Bullish Divergence(potential entry)ETH
Would you take this entry on the 2hr using this indicator?
On the higher timeframe(daily) we are holding above the 200 SMA which indicates a uptrend. Lower timeframe may be an opportunity for a pullback and entry back to the upside. Stop loss and TP1-TP4 included. This will be the first attempt back to ATH!

Ethereum in Daily Timeframe.The Ethereum daily timeframe chart shows significant technical levels. The local high is approximately $4,093, with a downward-trending resistance line indicating a bearish trend from this peak.
The initial support is around the $3,440 level, represented by a yellow dotted line. The main support is identified by a white upward trend line at $3,100.
Ethereum is currently trading around the $3,500 level. A break below this level could lead to further declines.
POV: ETH must hold the current support level; if not, be prepared for an 11% drop.
Do your own research before investing.
Regards
Team Dexter.

ETH - Retest 3400$Think we will see a retest of ~3.4k coming days. I am aware thas most people probably think it won't happen, it's too low, ETF bla bla, but I just ignore everything almost all the time and just look at the charts :)
I have traded the breakout from 3k to 3.6k and I'm flat currently but I think ETH is clearly not done yet but I won't buy at current prices.
Stay safe!

ETH, recent pump barely scratching the surface MASSIVE MOVE NEXT
ETH recent pump was an indication of things to come -- good things.
The coin went from 1700 to 1900 within 72 hours -- indicating that a longer shifting trend is about to materialize. Based on recent news, low supply of ETH is being detected on most exchanges depicting a bullish scenario for the coin.
On weekly data, new higher lows was created both on Histogram and pricing -- conveying the recent ascend with the current price range to be the new base for the incoming significant price growth.
Weekly data price movement volatility has been on the conservative side hinting that for every higher low it established -- it is creating a solid support range.
On Tri monthly data -- it is hinting of the same bullish continuation scenario. Surging price valuation on longer time spectrum. A bubble up volume has finally appeared after 5 months of waiting, last one was on January 2023.
Expect significant price valuation for ETH in the next coming weeks.
The weekly chart is too clean, direction is certain -- no further explanation needed.
Spotted at 1850.
TAYOR
Safeguard capital always

Ethereum Outlook ICT Consept📈💰 Welcome to Your Channel!
Welcome to your very own channel! Here, we embark on a collaborative journey to analyze and scrutinize financial markets, aiming to achieve substantial profits together. Today, let's dive into the exciting world of cryptocurrency, focusing on Ethereum .
📉🔍 Ethereum and Bitcoin Correlation
As you can see on the chart provided, Ethereum's movements mirror those of Bitcoin. This is because they are correlated pairs, often moving in the same direction or exhibiting similar price action.
🌟📈 Smart Money Technique
Comparing Ethereum to Bitcoin, you'll notice an SMT (Smart Money Technique) , which signals a potential bullish reversal. This suggests that we can expect a price reversal from the lows due to the presence of SMT.
🚀📊 Bearish Fair Value Gap Analysis
Additionally, the SMT candle has formed a Bearish FVG (Fair Value Gap), indicating a likely price reaction. If we observe a lower timeframe setup and enter a long position today, we can anticipate the price reaching the CE (50%) level of the FVG. After this, we should take partial profits and trail our stop-loss, awaiting further price action for more insights.
📊📉 Bullish and Bearish Scenarios
Overall, we can expect a bullish movement for Ethereum. However, if the price fails to rise and continues to decline, we've marked critical levels, including the SSL (Sell Side Liquidity) below the SMT, and a significant unfilled FVG. We can expect a price reaction at these levels.
🚀📈 Stay Tuned for More Insights
Thank you for joining us on this insightful journey into the world of cryptocurrency! Understanding the dynamics of BTCUSDT and BTC.D can significantly enhance your trading strategy. Stay tuned for more market analysis and updates. Until next time, happy trading!
📊⚠️ Disclaimer
The information provided here is for educational purposes only and should not be taken as financial advice. Always conduct your own research and consult a licensed financial advisor before making any investment decisions. Trading cryptocurrencies involves significant risk and may not be suitable for all investors.

#ETH: eyeing a potential breakout on the 4-hour timeframe!Hey everyone!
If you're enjoying this analysis, a thumbs up and follow would be greatly appreciated!
ETH is currently trading within a falling wedge pattern, which can be a bullish reversal signal. There's support around $3420-$3480, which could act as a springboard for a price increase.
Here's what we're watching:
Breakout confirmation: A clean break and close above the upper trendline of the wedge is crucial for a potential trend reversal.
Upside potential: If the breakout is confirmed, we could see a significant price increase.
Invalidation:- 4hr candle close below $3400 level.
Let me know your thoughts in the comments below!
