Don't miss this analysis, it will help you!Eth appears to be at resistance and also I’m seeing some unusual amounts of eth being transferred to exchanges. Personally looking for price to move towards 2100-2500.
ETHUSDT trade ideas

ETH, recent pump barely scratching the surface MASSIVE MOVE NEXT
ETH recent pump was an indication of things to come -- good things.
The coin went from 1700 to 1900 within 72 hours -- indicating that a longer shifting trend is about to materialize. Based on recent news, low supply of ETH is being detected on most exchanges depicting a bullish scenario for the coin.
On weekly data, new higher lows was created both on Histogram and pricing -- conveying the recent ascend with the current price range to be the new base for the incoming significant price growth.
Weekly data price movement volatility has been on the conservative side hinting that for every higher low it established -- it is creating a solid support range.
On Tri monthly data -- it is hinting of the same bullish continuation scenario. Surging price valuation on longer time spectrum. A bubble up volume has finally appeared after 5 months of waiting, last one was on January 2023.
Expect significant price valuation for ETH in the next coming weeks.
The weekly chart is too clean, direction is certain -- no further explanation needed.
Spotted at 1850.
TAYOR
Safeguard capital always

ICT Long setup ETHUSDT intraday and swing trade👋Hello Traders,
Our 🖥️ AI system detected that there is an ICT Long setup inETHUSDT for scalping.
Please refer to the details Stop loss, FVG(Buy Zone),open for take profit.
For more ideas, you are welcome to visit our profile in tradingview.
Have a good day!
Please give this post a like if you like this kind of simple idea, your feedback will bring our signal to next better level, thanks for support!

ETHUSDT waiting for correction to buy then sell at 4400-4700Buy ETH around 3300-3600.
Stoploss 3000
Sell 4400-4700
This moment is a bit sensitive so waiting is patient and take the profit.
Ethereum (ETH): What Now After ETF Approval? Ethereum is back at a major resistance zone where we see big similarities with the Bitcoin ETF.
The price is still showing slow bullish signs near the major resistance zone, where there might be one last "push.".
We are now looking for a potential rejection to happen from that zone, which would result in a nice downward movement!! For now, all we can do is wait and keep monitoring!
Swallow Team

📊#ETH double bottom target achieved, be wary of callbacks⚠️📊#ETH double bottom target achieved, be wary of callbacks⚠️
🧠We followed the daily-level double bottom long structure and broke through the short defense point after skyrocketing. This means that the double top short structure was destroyed, which means that this period of correction is over. Combined with the general trend, it is a bull trend, so we have a view on the future trend. It's going to be very optimistic.
➡️Although it is an optimistic attitude, we are currently in the daily-level selling zone. I will not chase the increase under the selling pressure, so we have locked all the profits from the long orders in our own pockets very early.
➡️If we choose to continue rising, then we will use the ETH spot purchased in the daily level buy zone to look forward to more.☕️🙏🎯
👀From a structural point of view, the breakthrough of the short defense point means that it will be sooner or later for us to break through the previous high, so when the price falls back again, it is a good time for us to enter the market again. The first support can be focused on near the inflection point.🔥
Don’t forget risk management💯
✔️Trade safe✔️
🤜If you like my analysis, please like 💖and share it

Lingrid | ETHUSDT in CONSOLIDATION phaseThe price perfectly fulfilled my previous idea. It hit the target level. BINANCE:ETHUSDT has broken out of its range zone and is now extending its upward momentum. As the market approaches the critical resistance level at $4000, it's trading slightly below this key area. A closer look at the price action reveals a double top formation, which could potentially lead to a pullback. If the price makes a fake breakout at support zone around 3550 - 3500, I believe it could set up for further upside movement. This is because the price has demonstrated strong bullish momentum, as evident from the series of higher lows and swing highs. Furthermore, the weekly timeframe shows a significant bullish candle, indicating market dominance and a strong upward trend. My goal is the resistance zone at 4000.
Traders, if yTraders, if you liked this idea or if you have your own opinion about it, write in the comments.

ETH PriceThe second largest cryptocurrency, Ethereum (ETH) coin has backed momentum and pumped up over 25% this week.

ETH ProjectionI wouldn't be at all surprised it this simple analysis of the weekly ETH chart plays out. Massive cup and handle pattern played out. Short handle held the 0.618 line then broke out. With a target out of this pattern around the 10-11K mark.
Any thought on this one. Simple but potentially possible.

ETH Bullish Pennant | ETF approval confluence | Target: 2021 ATHNot Financial Advice
TL;DR Bullish Pennant on BINANCE:ETHUSDT daily chart, upwards breakout target would be very close to 2021 ATH. SEC approval of VanEck ETF (final deadline on May 23) could be a major catalyst.
A rare case of (potential) technical and fundamental confluence:
ETH has been building a Bullish Pennant since the end of the Feb 5 - Mar 12 rally
The retest of the multi-month support in place since October 2023 might signal that the bottom is in
The final deadline for SEC's approval of VanEck's ETH ETF lines up almost perfectly with the convergence between the pennant's resistance and the multi-month support
Interestingly enough, the target for an upwards breakout of the pennant around VanEck's approval deadline would be very close to the 2021 ATH

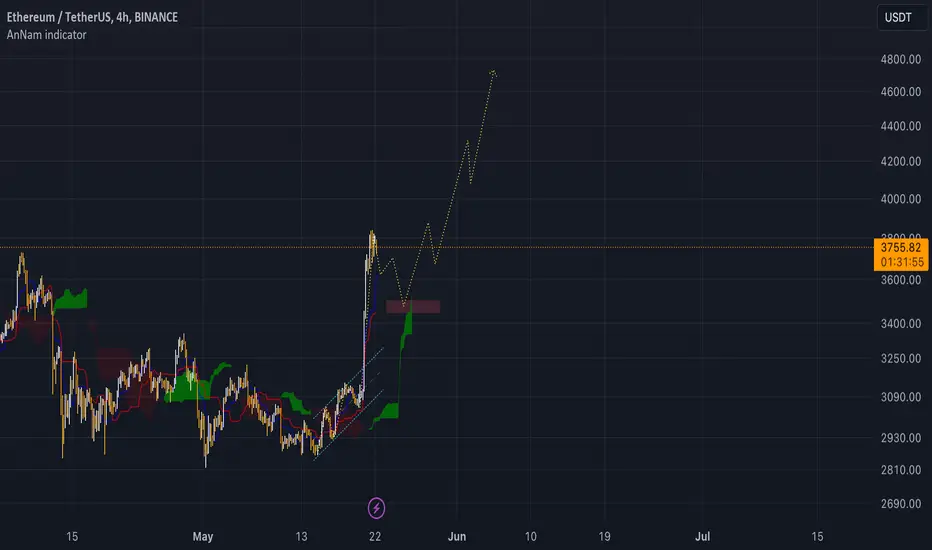
ETH - It is Happening! 🦋Hello TradingView Family / Fellow Traders,
As per my last analysis, shown in the attached chart, ETH rejected the $3000 round number and surged by over 20%.
What's next?
📈As long as the $3500 round number holds, we expect a continuation towards the previous all-time high of around $4800.
📚 Always follow your trading plan regarding entry, risk management, and trade management.
Good luck!
And always remember:
All Strategies Are Good; If Managed Properly!
~Rich

ETH: Descending Triangle Breakout on 4-Hour Chart!!Hey everyone! If you find this content valuable, please consider giving it a thumbs up and following for more analysis.
The interesting technical pattern forming for ETH on the 4-hour timeframe. The price appears to be consolidating within a descending triangle pattern. If a confirmed breakout occurs above the upper trendline, it could signal a potential price increase towards the $3800-$4000 resistance zone.
However, it's important to consider the invalidation point. A daily close below the $2900 level would weaken the bullish case for a breakout and suggest a potential decline.
What are your thoughts on this ETH setup? Share your analysis in the comments below!

📈Ethereum: Awaiting ETF Approval📣🔍Let's dive into today's analysis. Today's focus is on ETH, which recently experienced a 28% pump in anticipation of the potential approval of an Ethereum ETF. As I mentioned in my previous analysis, breaking the $2964 level was crucial, and it provided a strong trigger for opening a position, leading to a 28% gain with a high risk-to-reward ratio.
📰Today, the final decision regarding the ETF is expected to be announced. If approved, Ethereum could see another pump, potentially surpassing the $4063 level and aiming for its all-time high (ATH) around $4600. However, if the ETF is not approved, Ethereum is likely to dump, possibly losing the $2880 support level amid market fear and excitement, which would be bad news for ETH holders. Personally, I believe the ETF is more likely to be approved, leading to another pump in Ethereum's chart.
🔔The announcement is just a few hours away. If you believe the ETF will be approved, I suggest moving to lower timeframes, finding a trigger based on your strategy, and opening a long position. Conversely, if you think the ETF will not be approved, you can apply the same approach for a short position.
📈Ignoring the ETF news and focusing purely on technicals, the RSI is significantly overbought, reaching as high as 89. This indicates high market excitement, and the RSI is now starting to come down but hasn't exited the overbought territory yet. There is a high probability of range-bound movement until the price meets the SMA25, potentially forming a box near $3798. After the SMA25 convergence, we might see renewed momentum. If the price breaks $3798 sooner, it would be even better as the resistance would be broken with more bullish momentum, allowing the price to move up more smoothly and with fewer candles.
🚀For long position targets, consider the $4063 resistance as the first target. If this resistance is surpassed, the next target would be the $4600 ATH.
📉For shorts, as long as the volume of red candles continues to decrease, I wouldn't consider shorting. To short, wait for the SMA25 to reach the candles, and if the bottom of the box breaks with increased selling volume, you could enter a risky short position. Given this would be against the primary market momentum, you should take profits quickly.
💣The main short position to watch for a complete trend reversal would be the break of the $2880 support level.
📝In conclusion, Ethereum is at a critical juncture with the potential ETF approval news imminent. If approved, we could see significant bullish movement towards and beyond $4063, aiming for the ATH around $4600. On the other hand, if not approved, Ethereum might experience a notable drop, potentially losing the $2880 support. From a technical perspective, watch the RSI and SMA25 interactions closely, and plan your trades based on the key levels and volume confirmations mentioned above. Always stay informed and be ready to adjust your strategy based on market developments.

ETH - Retest 3400$Think we will see a retest of ~3.4k coming days. I am aware thas most people probably think it won't happen, it's too low, ETF bla bla, but I just ignore everything almost all the time and just look at the charts :)
I have traded the breakout from 3k to 3.6k and I'm flat currently but I think ETH is clearly not done yet but I won't buy at current prices.
Stay safe!

ETHEREUM ETF With the Ethereum ETF decision just days away, ETH has made a massive breakout play in an effort to front run a positive ETF outcome, the approval of VanEck and ArkInvest/ 21Shares ETH ETFs on the 23rd & 24th May respectively.
In terms of price action and charting this is how I see it. Now that price has broken out from the downtrend and hit the Bearish OB as shown, I think many were caught of guard and expected any sort of volatility to come on the day of the decisions. Instead it seems many have decided to front run the decision and go long which opens up more challenges. I think ETH had priced in a rejection of the ETF at ~£3K , with how the SEC has viewed ETH and it's stance on insisting it's a security, Coinbase estimated a 30-40% chance of an approval last weekend. Now that price has risen almost as if we already have news of approval I think that should the ETF be denied we could fall straight back down to $3K area with support areas shown as targets on the chart. This would print a Bart Simpson style pattern and many Longs will be devastated.
On the other hand, Bloomberg have said that the chances of approval has gone from 25% to 75% and the chart shows this new level of optimism. If the ETF is approved I could see ETH using this current level as a base to target new local highs and close the gap on BTC dominance.

ETH with bullish divergence on the 4hr time framelooks bullish
if price breaks below $3659
price may retrace to $2800
bullish divergence is currently playing out
due to market cap 2nd target may take several weeks
not financial advise

ETHUSDT-Bullish Wave Coming Soon Detailed Analysis of #ETHUSDT
Time Frame: 1 Day (1D)
Overview
ETH/USDT has recently broken out of a falling wedge pattern, a bullish reversal pattern. This breakout indicates the potential for a substantial price increase, with an expected bullish move of up to 40% in the coming days.
Key Elements
Falling Wedge Pattern:
The falling wedge pattern is characterized by two converging trendlines that both slope downwards. This pattern forms when the price consolidates and the volatility decreases, indicating a potential reversal.
The breakout above the upper trendline of the wedge suggests the end of the previous downtrend and the beginning of a new upward trend.
Pattern Breakout Confirmation:
The breakout from the falling wedge has been confirmed, signaling a shift in market sentiment from bearish to bullish.
This breakout is a key indicator that the price is likely to increase as the market dynamics have shifted in favor of buyers.
Volume Analysis:
A significant increase in trading volume accompanying the breakout is often a key confirmation signal. It indicates that the breakout is supported by strong market participation and investor confidence in the new trend.
Sustained higher volumes post-breakout are crucial for the continuation of the uptrend and to validate the breakout.
Historical Price Behavior:
Analyzing historical instances of falling wedge breakouts in similar market conditions can provide insights into the potential price movement.
Historical analysis can help validate the anticipated magnitude of the price increase and the timeframe over which it might occur.
Market Sentiment and Fundamentals:
Broader market sentiment can significantly impact the price movement of ETH/USDT. Positive developments in the cryptocurrency market can bolster the bullish outlook.
Fundamental factors specific to Ethereum, such as network upgrades, increased adoption, and positive news, can act as catalysts for price increases.
Monitoring news and developments related to Ethereum is crucial for anticipating potential market reactions and understanding the drivers behind price movements.
Risk Management
Stop-Loss Orders:
Implementing stop-loss orders below the breakout point of the falling wedge can help protect against potential downside risk.
A recommended stop-loss level could be set at 5-10% below the breakout point to account for market volatility.
Position Sizing:
Ensure that your position size is consistent with your overall risk management strategy. Avoid over-leveraging and manage your exposure to maintain acceptable risk levels.
Proper position sizing helps mitigate the impact of potential losses on your overall portfolio.
Take-Profit Levels:
Establish take-profit orders at intervals that align with the anticipated 40% price increase.
Consider scaling out of the position incrementally to lock in profits and reduce the risk of market reversals.
Conclusion
The breakout from the falling wedge pattern in the daily timeframe for ETH/USDT suggests a bullish outlook with the potential for a 40% price increase in the coming days. This bullish expectation is supported by the confirmed pattern breakout and strong volume signals. Nonetheless, it is essential to remain adaptable to changing market conditions and employ robust risk management practices to protect investments.
Note: Cryptocurrency trading involves significant risks. Conduct thorough research and consider consulting with a financial advisor before making any trading decisions.

What if it was all the liquidation trap I don't know what's gonna be happen but ya what will happen will be happening soon. It's the moment that it will go up or it will turn round. No guess what's gonna happen 🤪

Ethereum Price Predications on the Daily timeframeEthereum (ETH) Price Analysis and Predictions for 2024
In this analysis, we explore Ethereum's current bullish trend, key support and resistance levels, and potential price targets. Using daily and weekly charts with indicators such as the 50 EMA, 200 EMA, RSI, and Stochastic RSI, we provide a detailed outlook on ETH's price movement. Watch for potential pullbacks to $2,900 support and aim for price targets at $4,046, $5,626, and $7,000. Join the discussion and share your thoughts on Ethereum's future!

ETHUSDT is BullishIt seems that bulls have won the control of price action back from the bears as the price successfully printed a higher low, and is now ready to break previous higher high. A bullish rally is on the cards which could easily catapult price to 5k. Targets are mentioned on the chart.

Wait for Correction!DO NOT FORGET USING A STOP LOSS
Warning:
This is just a suggestion and we do not guarantee profits. We advise you analyze the chart before opening any position.
I hope you are always profitable

ETHUSDT IDEAHello Trading view Family / Fellow Traders.
I hope you have used and benifited from the previous analysis .
In today trading session we are monitoring ETHUSDT for a buying opportunity,\
ETHUSDT UPDATE
Moving As Expected Moving Towards Our Targets Running In almost +20% Profit So Far 💥
Looking positive to hit our target💸🚀

ETH: Reaction to leve-priceAnalysis by ahmadArz📊 ETHUSDT
This chart represents the Ethereum to Tether (ETHUSDT) pair on a 4-hour timeframe. The analysis of the chart includes several key price levels and potential price movement patterns.
1. **Key Price Levels:**
- **$3950.23**: A strong resistance level where the price has reacted in the past. 📈
- **$3720.77**: Another resistance level near the current price (3736.24). 📊
- **$3410.90**: A support level to which the price might return. 📉
2. **Potential Patterns:**
- Two curved arrows indicate two possible scenarios:
- **Bullish Scenario**: If the price breaks above the $3720.77 level, it is likely to move towards the $3950.23 level. 🚀
- **Bearish Scenario**: If the price fails to break the $3720.77 level and declines, it might reach the support level of $3410.90. 🔻
3. **Reaction to Price Level:**
- The text on the chart "Waiting for reaction to level-price" suggests that the analyst is waiting for the price to react to the $3720.77 level to decide which direction the price will move. ⏳
4. **Black Arrows:**
- The black arrows on the chart indicate key points where the price has reacted in the past. 📍
In summary, this analysis suggests that if the price can break the $3720.77 resistance level, it will likely move towards the next resistance at $3950.23. However, if it fails to break this level, it might return to the support level at $3410.90. The analyst is waiting for the price reaction at these key points to determine the next direction.
