Approaching Important levels here ETH/USDT Was just testing some new indicators on the 30 min chart and well need I say more....
This should finally lead to some wanted confirmation of direction!
Happy Trading.
T.
ETHUSDT trade ideas

✴️ Ethereum Is In Danger | Pattern #2 Explained!See the period labeled "6-weeks green"?
➖ We saw this back in 2022.
Right after the sixth week that closed green Ethereum went down for 98 days.
It took 140 days or 20 weeks before Ethereum got back on the green.
➖ We just had a period of 6-weeks green in early 2024. It ended two weeks ago.
Last week closed red and it was the first red week after this abnormal 6-weeks up.
If we get similar action as in the past, Ethereum can drop for months.
Can you notice the peculiar pattern on the chart?
Boost if you do...
Thanks a lot for your continued support.
Namaste.

ETH PREPPING FOR BTC HALVING PUMPEth is primed to break from this bullish falling wedge, we got a well needed dip in the overall market after pumping for some time but don’t disregard this falling wedge, breakout near halving date imminent

ETH ProjectionsThe current state of the chart suggests that Ethereum is in a corrective phase after completing a bullish cycle. The bearish outlook is supported by the price's position relative to the Ichimoku Kinko Hyo and the 200 EMA, Alongside with the corroborating bearish signals from the RSI and MACD. However, the potential for a reversal should not be dismissed lightly!
key indicators and price movements should be closely monitored for signs of a bullish breakout...
While technical analysis provides a good framework, it is essential to consider external factors such as market news, Global economic indicators and developments specific to ETH and the wider Crypto market, which can significantly influence price action.
Happy Trading.
T.

ETH Bearish Projection - Short OpportunitiesRelative Strength Index (RSI), showcasing a neutral momentum with slight bearish undertones as the indicator hovers just above the 40 mark,
MACD Displaying Bearish momentum, - Possible bullish reversal if a crossover occurs
The On-Balance Volume (OBV) indicator, while relatively flat, serves as a measure of volume flow, providing insight into the strength behind price movements. The lack of significant volume change suggests a consolidation phase, awaiting stronger market conviction for the next decisive move,
200EMA,
Ichimoku Kinko Hyo,
Happy Trading All. T

An expected rise The price of Ethereum is expected to rise in the coming hours. The price is heading to $3,600

ETH/USDT Long position setupAfter making series of LH AND LL Eth made a first HH. Moving Above precious LH will indicate a price reversal thus making an entry after first HH with 1:1 RR.

ETH ShortETH looking weak in the short term .... just looking at patterns on a smaller scale! Auto Fib / Many Timeframes /Ichimoku Kinko Hyo / 200 EMA / Personal indicators. Sort term opportunity on a small timeframe after confirmation .... Happy trading T

ETH Short term patternsEth showing signs of weakness to me in the short term so far unless we can break out of this annoying cycle! Make your mind up Go up or down Properly! Still believe there is plenty room for movement toward the upside yet in the long run.... just waiting for some clear signals before we have any clear indications.

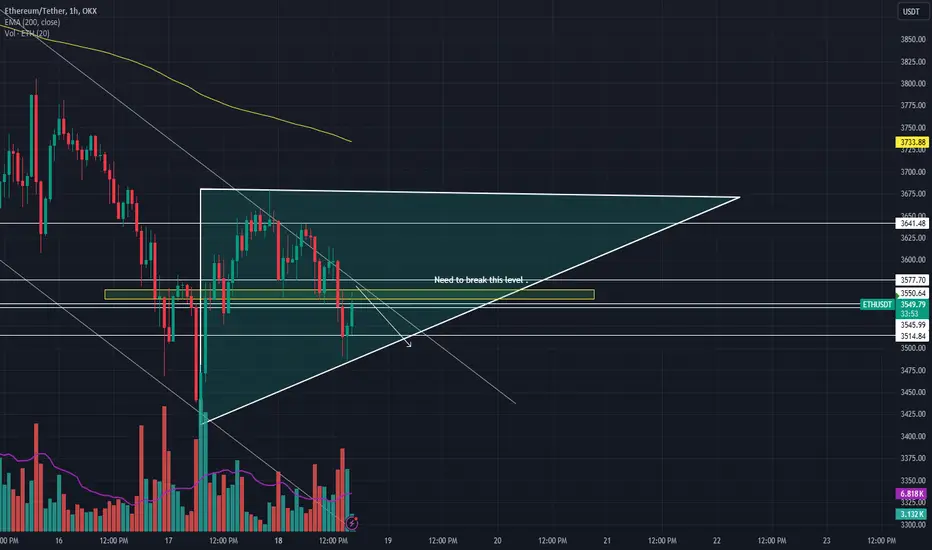
ETH ResistanceI have extended the wedge as I believe price will respect these points, Really need to clear 3560.00 with confidence for any confirmation of upwards or downwards action! Auto Fib / Ichimoku / 200 EMA / Personal indicators. Happy trading. T
Eth Quick shortNoticed a Rising wedge pattern before on the 1 hour ETH time frame, Tested a quick paper short on the 5 min timeframe, Clear bearish pattern :( Also noticed falling volume. should have really posted before I went out but I am very tired! Will be posting some more testing and ideas tomorrow after a good rest! Good example of looking for quick trades working back in timeframes (from 4 hours) Ichimoku Kinko Hyo, Auto fib, 200 EMA. Tomorrow will be on Elliot wave and new indicator projections on some new more volatile coins! Happy trading. T

HelenP. I Ethereum will rise a little and then fall to $3445Hi folks today I'm prepared for you Ethereum analytics. Some time ago price rebounded from the support level, which coincided with the support zone and started to rise, but after ETH little rose, it turned around and made impulse down lower the 3445 support level and even the support zone. But soon, the price turned around and in a short time rose back and even soon reached the resistance level, which coincided with the resistance zone, after which ETH broke this level and some time traded in this zone. Later price made a correction below the resistance zone to the trend line, after which Ethereum rebounded back and even rose a little higher. Price a little more time traded near the resistance zone and then started to fall in a downward channel, where it broke the 3910 resistance level and fell below. Soon, the price made a retest of the resistance level and continued to fall to the support level, and when it declined to the 3445 level, it at once rebounded and started to grow. Now, I expect that ETH will rise a little more, after which it turn around and continue to decline to the support level. That's why I set my target at the 3445 level. If you like my analytics you may support me with your like/comment ❤️


📊#ETH reaches the buying zone✔️🧠The structure of ETH will look clearer. The goals of the double top short structure have been fully achieved, so we stopped the decline in the buy zone, which makes perfect sense.
➡️Waiting patiently and trying are processes that must be experienced in trading. We don't know how the market will go, so we don't need to guess. We just need to look for the long structure in the buying zone and try it.
⚠️Only if we can accept failure calmly can we enjoy profits.💯
⚠️At the same time, don’t forget about risk management.

The key is whether it can rise above 3900.73-4294.78Hello traders!
If you "Follow" us, you can always get new information quickly.
Please also click “Boost”.
Have a good day.
-------------------------------------
(ETHUSDT 12M chart)
The BW indicator is an indicator expressed by combining MACD, StochRSI, CCI, superTrend, and PVT indicators.
By displaying this BW indicator on the price chart, we made it intuitive to understand.
Therefore, points marked with the BW indicator can be used as support and resistance.
The key is whether it can rise above the Fibonacci ratio 1 (5005.30) and renew the new high (ATH).
If the price holds above 5005.30, the next target is expected to be 1.618 (7362.80).
(1M charts)
It has broken through the upper part of the box section of the HA-High indicator and is rising.
Accordingly, if the price stays above 3900.73, it is expected to start rising to renew the new high (ATH).
If not, and it falls, you need to check if it is supported around 3321.30 or 0.618 (3548.07).
(1W chart)
The key is whether it can receive support and rise in the 3962.19-4294.78 range.
If it falls, you should check for support around 3503.68, the bottom point of the box section of the HA-High indicator.
(1D chart)
The next period of volatility will be around March 25th.
However, you need to check which direction you can deviate from the 3503.68-4294.78 range.
If it receives support around 9300.73-3962.19, it is expected to rise above 4294.78.
Therefore, if it falls below 9300.73 and shows resistance, there is a possibility that it will turn into a short-term downtrend.
Have a good time.
thank you
--------------------------------------------------
- The big picture
The full-fledged upward trend is expected to begin when the price rises above 29K.
This is the section expected to be touched in the next bull market, 81K-95K.
#BTCUSD 12M
1st: 44234.54
2nd: 61383.23
3rd: 89126.41
101875.70-106275.10 (when overshooting)
4th: 13401.28
151166.97-157451.83 (when overshooting)
5th: 178910.15
These are points that are likely to encounter resistance in the future.
We need to see if we can break through these points upward.
Since it is thought that a new trend can be created in the overshooting area, you should check the movement when this area is touched.
If the general upward trend continues until 2025, it is expected to rise to around 57014.33 and then create a pull back pattern.
1st: 43833.05
2nd: 32992.55
-----------------

ETH Short term projection ...Still waiting for confirmation but looks to me like ETH is trying again, Watch out for all these levels. More than likely to be proven right or wrong tonight! UK time 7 - 10 PM (In my humble opinion) Hopefully we get some upwards movement and good volume tonight!
Ichimoku Kinko Hyo, 200 EMA, Monthly tops and bottoms, Auto fib on many timeframes. going one way or the other soon! Happy Trading.
T

ETH LET'S GO AGAIN Hello Traders and everyone, I am Hadi Karaali, Known as SNIPERS_FX
If you like the idea, do not forget to support with a like and follow.
ETH LET'S GO AGAIN 📚
👉As we can see price is still overall bullish trading above our rising trendline, and as we mentioned in our previous analysis, expecting a rejection from our upper resistance zone, for our correction to start.
👉Moreover, price is approaching our first rejection zone, where we will be looking for new longs, unless price managed to break below our support from Daily time frame, then a movement lower would be expected.
👉Until that and for the bulls to kick in we need a break above the marked major swing high on H1 time frame, then a movement higher would be expected. 📚
If you like this kind of analysis don't forget to like and follow
and as usual follow your trading plan and manage your risk.
Be patient and good luck!

ETHI think we have probably completed this wave down, there can be another drop if $3850-3,900 becomes resistance. Then I'd say $2,800-$3,200 will become the floor. But the map remains unchan..

ETH Historical data Custom indicator showing historical data for ETH. Indicator will be available soon once fine tuned .... I think this would be a fantastic and timesaving indicator for fans of Wyckoff. ETH all the way! Happy trading everyone! T

ETH Projections200 EMA, CDTI, 5EMA, Ichimoku Kinko Hyo, Auto Fib many timeframes, Personal indicators :) ETH all the way! .... Good or bad targets? please follow and comment! Happy trading. T

Eth⬆️⬆️Is on bullish divergence, buy the dip and hodl
This is not an advice dyorr
Enjoyy🌞
Whales will purchase⬆️⬆️

ETH is ready to dive deep to $2700As per my analysis ETH will fall to $2700 in upcoming days. you can plan your trades as per proper risk and reward ratio

weekend overviewIn simple terms, the article discusses the current state and potential future of Ethereum in light of new developments, including the Dencun upgrade, and Vitalik's views on competitors like Solana. The Dencun upgrade aims to enhance Ethereum's network by lowering transaction costs and improving scalability. Although competition in the blockchain space is heating up with alternatives like Solana, Ethereum continues to innovate, which could bode well for its long-term value. Such developments could positively influence Ethereum's price as the network becomes more efficient and user-friendly, attracting more users and use cases.
The long-term outlook for Ethereum, according to the article, remains optimistic despite competition from networks like Solana. Ethereum's ongoing upgrades, including Dencun, aim to reduce fees and improve scalability, which are expected to strengthen its position in the market. While Solana offers some competition, Ethereum's continuous development and the growth of its DeFi ecosystem suggest that it's well-positioned to maintain its leadership role. These advancements may potentially lead to an increase in Ethereum's price over time as the network becomes more efficient and continues to attract users.
In this 4-hour Ethereum chart, we see a recent upward trend where the price made higher highs and higher lows, indicating a strong bullish period. However, it looks like there's been a bit of a pullback with the price dropping and forming a red Heikin Ashi candlestick, which could signal a short-term downtrend or a correction within the larger uptrend. A key thing for beginners to watch is whether the price will find support at a previous low or if it will continue to fall, which could suggest a deeper reversal or a significant retracement before potentially climbing again.
Looking at the 1-hour Ethereum chart, it seems that the price experienced a period of rise, followed by a series of declines, indicated by red Heikin Ashi candlesticks, suggesting a bearish trend. The RSI (Relative Strength Index) Divergence Indicator at the bottom shows both bullish and bearish signals, which implies some price momentum changes and possible volatility. In simple terms, Ethereum's price has been fluctuating, and this mixed signal could mean uncertainty, making it crucial for traders to wait for a clear trend before making a decision. It's important to watch for the RSI to move out of any extreme areas and for the candlesticks to show a solid color change for more confident trend direction before entering any trades.
On this 15-minute Ethereum chart, you’ll see a pattern where the price hits the highest high (HH), which is the peak price in this timeframe, and the lowest low (LL), the lowest price reached. Recently, the price has dropped from a HH, signifying a potential downtrend, but it hasn’t broken past the last LL, which could act as a support level.
The Relative Strength Index (RSI) shows a recent 'Bull' signal, meaning the momentum might be shifting towards an upward trend. For an entry point, watch if the RSI continues to rise and look for the price to move above recent short-term highs (HH) for confirmation of an uptrend. Remember, for an exit point, you'd typically set it below the last LL to minimize potential losses. Always ensure these observations are coupled with your trading strategy and risk management.
