EthereumI am taking Ethereum long. Risk is clearly defined, and I believe there is good upside to be had.
I have been filled at $3,027
ETHUSDT trade ideas

Golden Opportunity for Longing.Based on the historical market, the bitcoin halving event would followed with a significant price growth of the crypto assets, which matches the current market status. Thus, a bull market are expected in the next one and a half year.
As for the sentiment analysis, the current funding rate in bitcoin perpetual market are maintaining a slight negativity in the past 2 weeks, that indicate a stronger short bias in the general market. And the open interests drops up to 20~30% from its all time high, in which alt coin market drops even further, for instance open interest of dogecoin dramatically drops 60% up to todays date. Therefore, its treated as a cooling off of the bull hype in first quarter of 2024, which viable long opportunities are provided.
Above statement convey that a definite bull market are expected from now to the coming 2025, and current the market sentiment are expecting a strong short bias, which given a much higher liquidity for accumulation. Therefore technical analysis can be deploy to identify longs opportunity.
Technical specking, by using the vegas tunnel system in combined with a retracement type of price entries, the current mark prices of ETH is matching the condition for a high risk reward ratio and a high winning possibility trade. And a much wider growth space in compare to the bitcoin market.
Personal fund deployment will be 50% of my total fund in with a 2x leverage utilities. This is not a financial advice, trader should align with owns trading plan which present owns reponsibility.

ETH: Reaction to leve-priceAnalysis by ahmadArz📊 ETHUSDT
This chart represents the Ethereum to Tether (ETHUSDT) pair on a 4-hour timeframe. The analysis of the chart includes several key price levels and potential price movement patterns.
1. **Key Price Levels:**
- **$3950.23**: A strong resistance level where the price has reacted in the past. 📈
- **$3720.77**: Another resistance level near the current price (3736.24). 📊
- **$3410.90**: A support level to which the price might return. 📉
2. **Potential Patterns:**
- Two curved arrows indicate two possible scenarios:
- **Bullish Scenario**: If the price breaks above the $3720.77 level, it is likely to move towards the $3950.23 level. 🚀
- **Bearish Scenario**: If the price fails to break the $3720.77 level and declines, it might reach the support level of $3410.90. 🔻
3. **Reaction to Price Level:**
- The text on the chart "Waiting for reaction to level-price" suggests that the analyst is waiting for the price to react to the $3720.77 level to decide which direction the price will move. ⏳
4. **Black Arrows:**
- The black arrows on the chart indicate key points where the price has reacted in the past. 📍
In summary, this analysis suggests that if the price can break the $3720.77 resistance level, it will likely move towards the next resistance at $3950.23. However, if it fails to break this level, it might return to the support level at $3410.90. The analyst is waiting for the price reaction at these key points to determine the next direction.

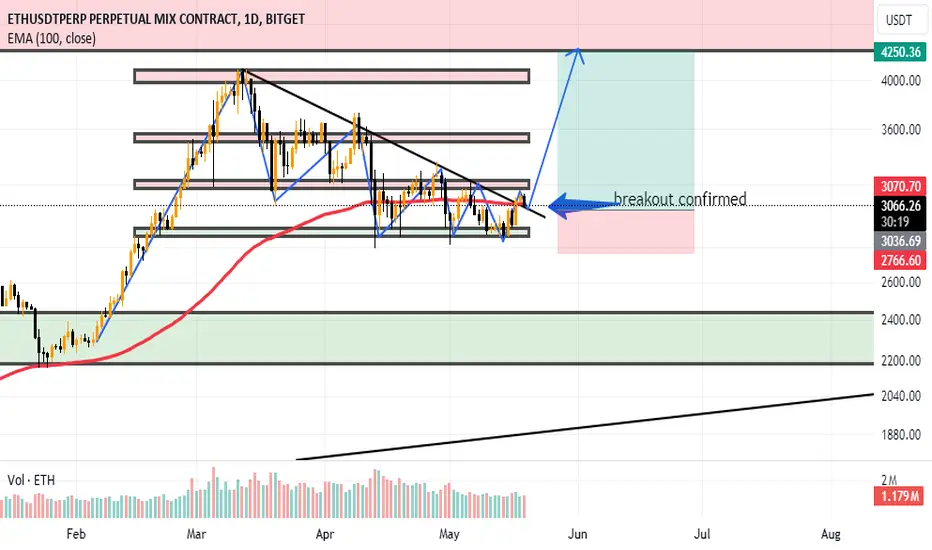
ETH Breakout confirmed on 4hETH 4h breakout confirmed market come to retest the trend line
lets take long entry
swing trade
entry :- 3060
take profit :-4050
stoploss:-2750
thanks me later
Check for support in the 2nd sectionHello traders!
If you "Follow" us, you can always get new information quickly.
Please also click “Boost”.
Have a good day.
-------------------------------------
(ETHUSDT 1M chart)
The key is whether it can receive support near the Fibonacci ratio point of 0.618 (3548.07) and rise above the upper point of the HA-High indicator box on the 1M chart.
If the price is maintained above the HA-High indicator, I think there is a high possibility of a full-fledged upward trend.
Therefore, it is expected that a full-fledged upward trend will begin only when the price is maintained above the 3321.30 point, which is the HA-High indicator point on the 1M chart.
If not, and it falls, you should check for support around 0.382 (2647.80).
(1W chart)
It has touched the psychological volume profile zone and is rising.
The key is whether it can receive support in the 3503.68-3730.71 range and rise above 4093.92.
If not, and it falls, you should check for support around 3025.27-3321.30.
If the price maintains above 4093.92, it is expected to rise to around 4868.0.
(1D chart)
It should rise to the HA-High indicator box section (3570.0-4010.98) on the 1D chart.
Accordingly, the key is whether it can receive support around 3570.0 and rise above 3903.61-4010.98.
If the price is maintained above 3903.61-4010.98, a full-fledged upward trend is expected to begin.
The 3025.27-3321.30 section is the HA-High indicator section of the 1M and 1W charts, so it is an important section.
Since the price broke above this important zone with a sharp increase, if the price holds above 3025.27-3321.30, it is expected to renew the latest previous high.
---------------------------------------------
(1D chart)
Please refer to the HA-Low and HA-High indicators used to initiate trading and the BW indicator to verify them.
We need to check if we can receive support around the current secondary range, that is, the 3570.0-3730.71 range.
If you were unable to buy around 2817.0-3025.27, I think it would be a good idea to check for support in the 3903.61-4093.92 range and proceed with buying.
The reason is that the HA-High indicator was created and a high point was formed.
Therefore, the HA-High indicator point at 3903.61 can become a resistance point.
From a day trading perspective, if support is confirmed around 3570.0, you can buy and sell around 3903.61.
Have a good time.
thank you
--------------------------------------------------
- The big picture
The full-fledged upward trend is expected to begin when the price rises above 29K.
This is the section expected to be touched in the next bull market, 81K-95K.
#BTCUSD 12M
1st: 44234.54
2nd: 61383.23
3rd: 89126.41
101875.70-106275.10 (when overshooting)
4th: 13401.28
151166.97-157451.83 (when overshooting)
5th: 178910.15
These are points that are likely to encounter resistance in the future.
We need to see if we can break through these points upward.
Since it is thought that a new trend can be created in the overshooting zone, you should check the movement when this zone is touched.
#BTCUSD 1M
If the general upward trend continues until 2025, it is expected to rise to around 57014.33 and then create a pull back pattern.
1st: 43833.05
2nd: 32992.55
-----------------

ETHUSDT, Important update leaksWelcome, Trader. Welcome to our cryptocurrency community! 🚀We are delighted to welcome you, whether you are an experienced trader or a newcomer to cryptocurrency.
We are ready to discuss #ETHUSDT💹.
#ETHUSDT 🔥🚀.
Update:
Time frame: 8hr
➡️ ETHUSDT created a symmetrical triangle pattern and break it towards upside.
➡️ Breakout confirmation is done successfully.
➡️ Waiting for a retest confirmation.
➡️ We anticipate approximately 15% for the soon. 👉✅.

Will ETH to 6K?I think ETH will reach 6K if it can hold above the 3400 support and have a chance to break above the previous high in the future

Ethereum Parallel ChannelsEthereum parallel channel, the upper line is the top and the lower line is the bottom.

ETHUSDT (ethereum) going downward to 3438Hi friend. ETH show good bears accumulation zone (on image) we have a good chance to touch 3438. Follow me ;)

ETH Long Idea **Long Idea for Ethereum after the Approval of the ETF**
**Description:**
The approval of the Ethereum ETF is a significant catalyst for the cryptocurrency market, expected to bring increased liquidity and interest from institutional investors.
Based on technical analysis and current economic conditions, Ethereum shows strong signs of an upward trend.

ETHUSDT waiting for correction to buy then sell at 4400-4700Buy ETH around 3300-3600.
Stoploss 3000
Sell 4400-4700
This moment is a bit sensitive so waiting is patient and take the profit.
ETFWhen the Bitcoin ETF was confirmed, Bitcoin corrected 20% and then rose 90%
So we can expect Ethereum to correct up to 3190 and then go to 6110
Hoping for the best market

Long ETH Watch the chart and waiting up to 3815-20
If breaked you can long and if can't break it can be short p

#ETH #Ethereum 26/05/2024We stayed above the blue line and next target is red box. Breaking above this could lead to reaching 4188. Conversely, failing to surpass the red box may result in a pullback. Also, the large gap below is created by the breakout candle.

Wait for Correction!DO NOT FORGET USING A STOP LOSS
Warning:
This is just a suggestion and we do not guarantee profits. We advise you analyze the chart before opening any position.
I hope you are always profitable

Ethereum in Bull FlagEthereum in Bull Flag
You can clearly see Ethereum is in a bull flag and with the dump yesterday, the price has retested the support of the flag.

ETHUSDT IDEARisk warning, disclaimer: the above is a personal market judgment based on published information and historical chart data on Tradingview, all analysis is only subjective. Hope investors consider, I am not responsible for your investment decision. Thank you.
Good luck!

ETH ProjectionI wouldn't be at all surprised it this simple analysis of the weekly ETH chart plays out. Massive cup and handle pattern played out. Short handle held the 0.618 line then broke out. With a target out of this pattern around the 10-11K mark.
Any thought on this one. Simple but potentially possible.

ETHEREUM TRADE, I AM IN!Price of Ethereum is currently following my model.
I am also more interested in being a buyer than a seller as can be seen from the analysis
Therefore, my target for Ethereum is about $4k
Let's see how this plays out

ETHUSDT IDEAHello Trading view Family / Fellow Traders.
I hope you have used and benifited from the previous analysis .
In today trading session we are monitoring ETHUSDT for a buying opportunity,\
ETHUSDT UPDATE
Moving As Expected Moving Towards Our Targets Running In almost +20% Profit So Far 💥
Looking positive to hit our target💸🚀

ETH Long SetupPerfect Bull Flag By Clear ABC Structure Formed At Low Timeframe And The Price Bounced From The 3650$ Area As a Wave C PRZ, Expect a Legup To the 3900$ As a Short Term Target

✨ ETHEREUM TA AND EDITORS PICK!✨✨ Hey hey! Thanks for joining me! Crazy to think we're here and all today. I'm happy I was able to make a post on Ethereum's ETF being greenlit and so honored that I was picked by Tradingview for the Editor's picks. 3 years I've been here and I'm so grateful to each and every single one of you guys. Took 3 years to get one but it feels well worth and I owe it to all of you. Thanks so much. 🙏
✨ Gonna try and keep this short, I'm sure you all have a lot going on so let's follow up on things. To start us off we've got a chart from yesterday's idea for reference in which we added that ascending channel and spoke on a few subjects including the possibility of a reversal or retracement following the impulse wave up.
✨ So we've got that chart from yesterday's and now here's today's chart with a 15 minute approach for better depth, analysis.
✨ Understandably, we had this battle for support and Ethereum ended up losing a bit of ground once those 20/50 EMA's started flipping, but once we lost the ascending channel and started to exit, traders notably took profits and closed a lot of positions. That's fair though, you see it lose the channel and you don't really know how far things can dip but in this case we've managed to keep above $3,630 and avoid anything too significant, at least for now.
✨ What matters now is who wins this tug of war. Bears and Bulls are notably gonna be fighting as we're sitting in this crossroad with the 20,50 and 200 EMA. If we lose that 200 EMA chances are good that we'll slip back down and have to retest the two support points we've already hit which are labeled in blue.
✨ So we've got that fight on the local timeframe at least, bears want us to lose the 200 EMA and bulls should aim to regain it as well as push to break back into the ascending channel though being that we've not lost it, we should now consider that bottom line of the channel to be resistance should we pull back up there for future reference.
✨ If we end up getting the worst case scenario and we do lose that 200 EMA on the 15 and 30 minute timeframe then we could be facing a drop and possibly retest $3,500. It's been a while since we've been up here so here's a big picture with 3 horizontal levels from past times we we're here, use those 3 levels and feel free to add them, if we should fall thse could be the support points we see.
✨ So basically if we end up getting some sort of flash drop or reversing then look to the 3 points in the chart for reference, hope that helps!
✨ Said this idea would be short and it is, I'll be posting more later so make sure to keep tuned and thanks again, I appreciate all the support, the likes, the follows, the shares, you guys have been nothing short of supportive, thanks for everything! Keep tuned for more till next.
~ Rock '
