What do Ethereum fans think ? TM : 1hHello dear traders. You can see two areas on the chart, you can enter the position depending on the sale and buy area. And I made a serious decision to share the important areas of my personal strategy for free if supported.
ETHUSDT trade ideas

ETH monthly bullishAs, new month starts as per monthly analysis. Engulfing candle pattern formed. It can come to test FIB gold zone in this month. but looks promising for long my idea wait for monthly breakout or wait for FIB testing zone. but I will go long after this two confirmation. top of last bull run tradeline breakout retest and after this engulfing is created. Let's wait for the best don't forget to go long.

ETH/USDT 4HOUR CHART UYPDATE Hello friends, welcome to this ETH update from Crypto Sanders.
ETH/USDT Brief Update
Ethereum (ETH) is currently trading within a head and shoulders pattern on the 4-hour timeframe, as seen in the chart. Here are the key points:
ETH is showing a head and shoulders formation, which typically signals a potential bearish reversal.
Resistance and Support:
Around $3,950 to $4,000 (highlighted by the left and right shoulders).
Close to $3,640 (lower boundary of the pattern).
A breakout above the right shoulder (~$3,850) could lead to further gains.
A breakdown below the support level (~$3,640) would confirm the head and shoulders pattern, which signals a potential decline.
Monitor the $3,850 resistance level for signs of a breakout.
Keep an eye on a potential breakdown below $3,640 for bearish confirmation.
Stay tuned for further updates and analysis!
I have tried to bring the best possible results in this chart.
If you like it, hit the like button and share your charts in the comments section.
Thank you.

ETH fighting against strong resistanceHello everyone, let's take a look at the ETH to USDT chart on a one-day time frame. As you can see, the price is currently bouncing off the downtrend line.
Let's start by determining the support line and as you can see, the first support in the near future is $3,530, then you can see support at $3,250, and then we have a strong support zone from $3,046 to $2,796
Now let's move on to determining the resistance points. And here we must start by identifying a very strong resistance zone from $3,821 to $4,110, only when we manage to break out and positively test this zone, we can see a move towards the resistance at $4,917.
Looking at the EMA Cross 50 and 200 indicator, they still indicate that the strong upward trend is maintained.
There is still room for growth on the RSI indicator, while the STOCH indicator shows a move towards the upper limit, so you should be careful and take into account a possible recovery.

ETH - wait for entry
I'm waiting for ETH to go a little bit lower to enter.
My plan is as in chart.
Disclaimer:
This analysis is based on my personnal views and is not a financial advice. Risk is under your control.

Quick Bitcoin Update - 31 May 2024Hello Traders,
Checkout the latest update on Bitcoin and Eth. Still trading in range and we might see small liquidations

ETH Poised for Post-ETF Approval Pullback: Short to 3.2k ZoneEthereum surged over 30% in anticipation of its much-awaited ETF approval, but the excitement may be short-lived. As traders who missed the initial rally eye the $2.9k to $3.2k support zone, a pullback seems likely. With ETH currently trading around $3.8k, a short trade to this support area presents an attractive opportunity.
Technical Analysis:
Visible Range Volume Profile (VRVP): The VRVP indicates a significant volume zone at $3k, suggesting strong support at this level.
Average Directional Index (ADX): The ADX, a momentum indicator, is losing strength, signaling a weakening trend.
Proposed Short Trade:
Entry Price: 3.8k zone USDT
Take Profit: 3k zone USDT
Stop Loss: 4.110 USDT
Rationale:
The post-ETF approval euphoria is likely to fade, leading to a price correction.
The $2.9k to $3.2k zone represents a strong support area, as evidenced by the VRVP.
The weakening ADX suggests a loss of momentum in the uptrend.
Risk-to-Reward Ratio:
The potential risk-to-reward ratio for this trade is approximately 3:1, implying a potential 3% profit for every 1% risk.

Ethereum Daily FibonacciEthereum daily Fibonacci, the main target is a decline and correction to the price of 0.618~0.5, it is only a matter of time before it reaches that level.

ETHUSDT, strong growth to 3882 and higher.Hi friends. Ethereum showing strong bullish signal. We have bears distribution at green zone. So my opinion growth to 3882 and maybe higher. Support me! 💪

Ethereum Long IdeaLooking at 1H Timeframe, we observe market shift to break downtrend proceeding with a retrace to the Order Block, accumulation at order block and then breakout. If volume holds, price may tap unmitigated supply zones. These are my ideas alone and do not constitute financial advice.


ETHUSD Short IDEARisk warning, disclaimer: the above is a personal market judgment based on published information and historical chart data on Tradingview, all analysis is only subjective. Hope investors consider, I am not responsible for your investment decision. Thank you.
Good luck!

Is Ethereum bullish?📊 Due to the decrease in the downward momentum of the price movement, if the range of 3790 units is broken and the price stabilizes above it, the price may increase to the range of 3900 units 🎯 and in the case of the strength of the range of 4100 units🎯🎯.
📊 Otherwise, the price may fall to the range of 3350 units.

ETHUSDTIf the market enters correction, the important and supportive level of $3320 is reliable and it can have an upward movement with the target of $4080-4500.
It should be noted that the time period for the completion of this upward wave has not yet ended and it will continue until at least 1JUL
Price corrections can be a good buying opportunity for the desired time frame

ETHUSDT BUY ANALYSIS Here on ETHUSDT price has been moving down and has made a correction at support level of 3,710.86 so is like to move up for the level has been respected very so going for LONG is needed and targeting profits should be around 3,777.59

Lingrid | ETHUSDT in CONSOLIDATION phaseThe price perfectly fulfilled my previous idea. It hit the target level. BINANCE:ETHUSDT has broken out of its range zone and is now extending its upward momentum. As the market approaches the critical resistance level at $4000, it's trading slightly below this key area. A closer look at the price action reveals a double top formation, which could potentially lead to a pullback. If the price makes a fake breakout at support zone around 3550 - 3500, I believe it could set up for further upside movement. This is because the price has demonstrated strong bullish momentum, as evident from the series of higher lows and swing highs. Furthermore, the weekly timeframe shows a significant bullish candle, indicating market dominance and a strong upward trend. My goal is the resistance zone at 4000.
Traders, if yTraders, if you liked this idea or if you have your own opinion about it, write in the comments.

ETHUSDT 2400 😯ETHUSDT is trading in fine bullish trend and maintaining well the bullish trendline.
Whenever the price retest the bullish trendline buyers are attacking aggressively, which can be seen from the chart.
Currently the price is retracing to the inclining trendline and again it is being expected that the bulls are ready to attack.
if bulls take the charge this time too the next target could be 2400

Ethereum Price Predications on the Daily timeframeEthereum (ETH) Price Analysis and Predictions for 2024
In this analysis, we explore Ethereum's current bullish trend, key support and resistance levels, and potential price targets. Using daily and weekly charts with indicators such as the 50 EMA, 200 EMA, RSI, and Stochastic RSI, we provide a detailed outlook on ETH's price movement. Watch for potential pullbacks to $2,900 support and aim for price targets at $4,046, $5,626, and $7,000. Join the discussion and share your thoughts on Ethereum's future!

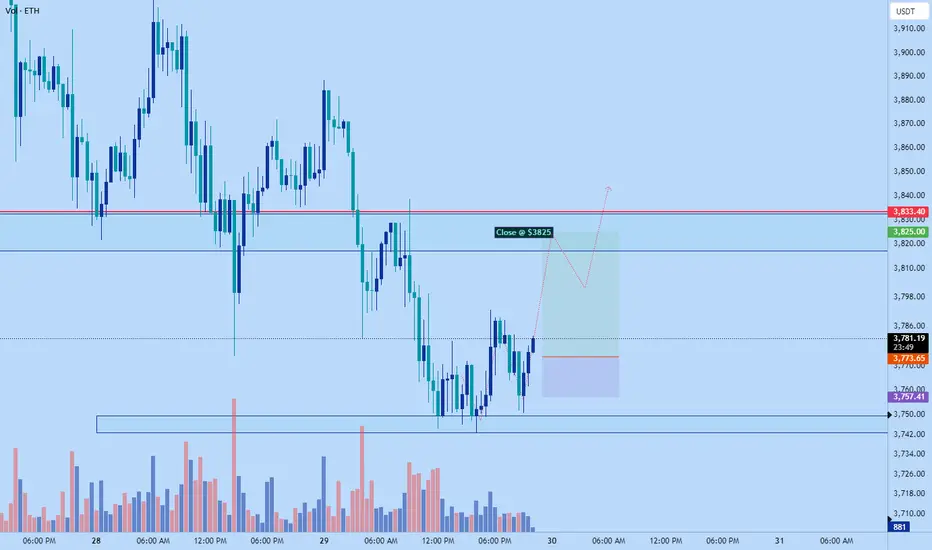
Eth take off now target $3825Eth is getting ready to push up. Price is at a low showing signs of reversal>
Target area $3825
Roughly 2.5-3RR depending on entry from current price.
ETHUSD SHORT IDEARisk warning, disclaimer: the above is a personal market judgment based on published information and historical chart data on Tradingview, all analysis is only subjective. Hope investors consider, I am not responsible for your investment decision. Thank you.
Good luck!

ETHUSDT-Bullish Wave Coming Soon Detailed Analysis of #ETHUSDT
Time Frame: 1 Day (1D)
Overview
ETH/USDT has recently broken out of a falling wedge pattern, a bullish reversal pattern. This breakout indicates the potential for a substantial price increase, with an expected bullish move of up to 40% in the coming days.
Key Elements
Falling Wedge Pattern:
The falling wedge pattern is characterized by two converging trendlines that both slope downwards. This pattern forms when the price consolidates and the volatility decreases, indicating a potential reversal.
The breakout above the upper trendline of the wedge suggests the end of the previous downtrend and the beginning of a new upward trend.
Pattern Breakout Confirmation:
The breakout from the falling wedge has been confirmed, signaling a shift in market sentiment from bearish to bullish.
This breakout is a key indicator that the price is likely to increase as the market dynamics have shifted in favor of buyers.
Volume Analysis:
A significant increase in trading volume accompanying the breakout is often a key confirmation signal. It indicates that the breakout is supported by strong market participation and investor confidence in the new trend.
Sustained higher volumes post-breakout are crucial for the continuation of the uptrend and to validate the breakout.
Historical Price Behavior:
Analyzing historical instances of falling wedge breakouts in similar market conditions can provide insights into the potential price movement.
Historical analysis can help validate the anticipated magnitude of the price increase and the timeframe over which it might occur.
Market Sentiment and Fundamentals:
Broader market sentiment can significantly impact the price movement of ETH/USDT. Positive developments in the cryptocurrency market can bolster the bullish outlook.
Fundamental factors specific to Ethereum, such as network upgrades, increased adoption, and positive news, can act as catalysts for price increases.
Monitoring news and developments related to Ethereum is crucial for anticipating potential market reactions and understanding the drivers behind price movements.
Risk Management
Stop-Loss Orders:
Implementing stop-loss orders below the breakout point of the falling wedge can help protect against potential downside risk.
A recommended stop-loss level could be set at 5-10% below the breakout point to account for market volatility.
Position Sizing:
Ensure that your position size is consistent with your overall risk management strategy. Avoid over-leveraging and manage your exposure to maintain acceptable risk levels.
Proper position sizing helps mitigate the impact of potential losses on your overall portfolio.
Take-Profit Levels:
Establish take-profit orders at intervals that align with the anticipated 40% price increase.
Consider scaling out of the position incrementally to lock in profits and reduce the risk of market reversals.
Conclusion
The breakout from the falling wedge pattern in the daily timeframe for ETH/USDT suggests a bullish outlook with the potential for a 40% price increase in the coming days. This bullish expectation is supported by the confirmed pattern breakout and strong volume signals. Nonetheless, it is essential to remain adaptable to changing market conditions and employ robust risk management practices to protect investments.
Note: Cryptocurrency trading involves significant risks. Conduct thorough research and consider consulting with a financial advisor before making any trading decisions.

Let's hope ETHEREUM DOES NOT do THIS 😨BINANCE:ETHUSDT
Ethereum is looking bullish after a strong bounce and a successful retest of the support zone at 2800.
According to all Fibonacci logic, we SHOULD be hitting the 1.618 zone SOON. But we're not out of the woods just yet. There's a risk of a very bearish pattern forming IF we cannot close the daily ABOVE our previous resistance zone. This would form a nasty M-Pattern that could takes us back to 2800 and even lower.
Technical indicators are extremely bullish right now, but this does not guarantee that sellers aren't waiting for us around the corner at 4000.
Naturally, we can expect ETH to keep on following BTC closely over the next week. If Bitcoin makes another leg up, Ethereum will soon follow a day or two later.
_______________________________

ETF approval will pump ETH price to a new ATHHi everyone,
After consolidation within 3000 - 2800 support area Ethereum price skyrocked on the news about possible ETH ETF approval. Few days ago ETH ETF has been approved and Ethereum price continue to rise even though Bitcoin price is slowly declining.
If Bitcoin price won't dump in the coming days then I expect Ethereum rise at least up to local high at 4080 price level but even if there will be some correction on Bitcoin I don't think that ETH price will significantly dump.
There is one thing to note about ETH ETF. Even though it was approved, the real trading will start at least one month later, so there is room for Ethereum price to go up or down before ETF trading starts. But overall ETF approval is a higly bullish news for Ethereum and most likely it will pump its price to new all time highs.
Please, do not forget to boost this idea & share it with your friends; thanks.
