ETHThe ETH trading setup appears favorable for a short position. The MACD indicator has shown a crossover, and with an appropriately sized stop loss, the setup offers a potential 1.5 times risk-to-reward ratio.
ETHUSDT trade ideas

Ethereum (ETH) Weekly AnalysisCurrent Situation:
Last week, Ethereum (ETH) moved sideways with a modest 1.5% price increase. Bulls made several attempts to push ETH above $3,900 but faced strong resistance.
Key Resistance and Support Levels:
Resistance Level: $4,000
Immediate Resistance: $3,900
Support Levels: $3,700 and $3,500
Price Action:
Despite multiple attempts, ETH has been unable to break the $3,900 level, indicating that the $4,000 resistance will require more time to be surpassed.
The sideways movement under this key resistance suggests that ETH is consolidating and preparing for a potential breakout.
Trend Analysis:
Bullish Outlook: The overall trend remains bullish. As long as the price continues to consolidate under $4,000, the asset has a good chance to eventually break this level and make new highs in 2024.
Support Levels: If sellers push the price lower, strong support is found at $3,700 and further at $3,500.
Looking Ahead:
June Outlook: Another attempt to break the $4,000 resistance could occur in June, given the current bullish trend and consolidation pattern.
Trade Strategy:
For Bulls: Monitor for a breakout above $3,900 and $4,000 for potential long opportunities targeting new highs.
For Bears: Watch the support levels at $3,700 and $3,500 for potential short opportunities if the price retraces.
Stay informed and ready for potential movements in the Ethereum market.
#Crypto #Ethereum #ETH #MarketAnalysis #SupportAndResistance #BullishTrend #PricePrediction #Cryptocurrency #Blockchain

BTC Short. We had a very aggressive green candle, which makes me believe they would want to recover this green vector, Once we reach tp1 we close 25% of the position. and set stoploss to entry. I don't expect it to reach till tp3. its about how it moves

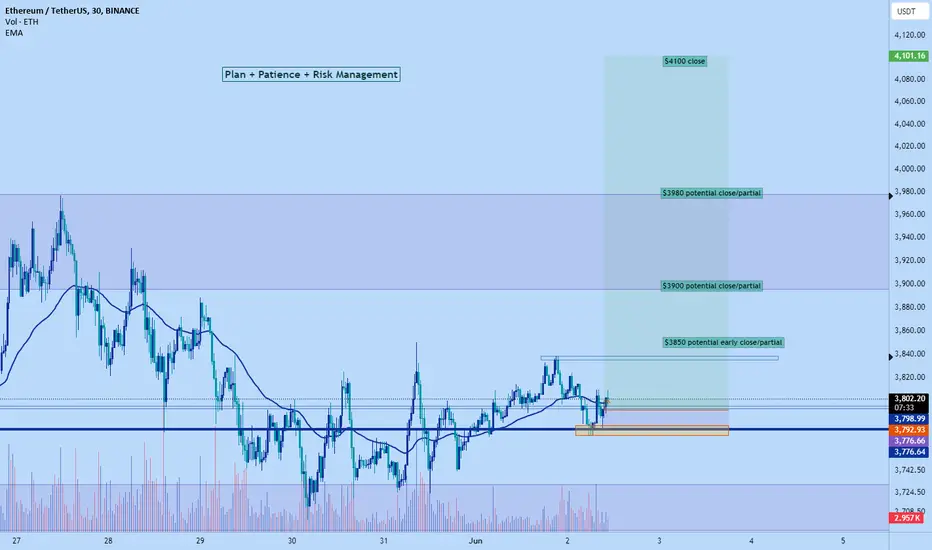
Eth pump to $3900 or higher today!I already entered the trade but still room to make decent RR for anyone who wants to follow along now. Price is at $3800 right now.
Price rejected daily support and have free space to move up to $3900, already showed signs of reversal with the 4hr shifting bullish and maintaining the $3800 area on retest.
Shifted bearish on 1hr last night but currently forming double bottom again support signs of reversal for continuation to the upside.
Htfs like weekly and monthly also bullish.
I got some other confirmations as well but lets keep it short.
I'll leave my TP open for now and monitor at the prices shown on my chart. I'll update here if I make a decision to take partial or close- If no update then am holding. Hard close at $4100 if somehow we get enough volume to pump there today. I anticipate a short squeeze just don't know if it be today or tomorrow - It depends on volume.
$3900 seems like a reasonable target for today though.
ETH - Make or Break Zone!Hello TradingView Family / Fellow Traders,
ETH has been hovering within a narrow range in the shape of a flat rising channel around a massive resistance zone $4,000 - $4,100.
What's next?
Scenarios:
1️⃣ Bullish - Continuation
The bulls maintain control as long as ETH is trading within the rising channel marked in red.
In this case, a movement towards the $4,000 - $4,100 resistance zone would be expected.
2️⃣ Bearish - Correction
If the last low marked in green is broken downward, we will expect the bearish correction to start leading to a movement towards $3,100 demand zone.
Which scenario is more likely to happen first? and why?
📚 Always follow your trading plan regarding entry, risk management, and trade management.
Good luck!
All Strategies Are Good; If Managed Properly!
~Richard Nasr

$ETHChart definitely looks way more bullish then BTC
Currently consolidating above support. To be honest not really got a clear read on this would be looking for maybe a move into $3,630's for a long. Its a chart I'd rather look at once a move has happened.

Ethereum (ETH) Market Analysis🔍Ethereum (ETH) is the coin of the day, a project that stands out from other altcoins due to its significant market dominance and substantial capital investment in both its network and coin. Unlike many other altcoins, Ethereum is less dependent on Bitcoin, making it an interesting asset to analyze independently.
🔄Previous Analysis Recap
In the previous analysis, it was suggested to enter a long position upon breaking 3798 with a target of 4063. After entering the position and reaching a risk-to-reward ratio of 2, I took partial profits and moved my stop loss to the entry point. The price did not move higher and eventually hit the stop loss at the entry point, resulting in a small profit due to the partial profit-taking.
⌛️4-Hour Timeframe
Current Situation: After forming a low at 3652, the volume has significantly decreased. Given the weekend lull, market momentum has completely dissipated. The 99-period SMA is approaching, potentially acting as the last hope for bullish momentum to re-enter the market.
🔑Key Levels:
Resistance: 3960 (first resistance), 4063 (key resistance)
Support: 3652 (current low)
⚡️Indicators:
RSI: Watch for a break above 54.46 for bullish momentum confirmation.
99-period SMA: Approaching price, may provide support or resistance.
📈Bullish Scenario
Entry: Break above 3960.
Target: Initial target at 4063.
If 4063 is broken and price stabilizes above this level, a significant upward move could be expected, especially benefiting Ethereum ecosystem coins.
Confirmation: RSI breaking above 54.46.
Long Position
Primary Trigger: Enter on a break above 3960.
Secondary Trigger: Enter on a break and stabilization above 4063 for a stronger bullish confirmation.
RSI Confirmation: Watch for a break above 54.46 to confirm bullish momentum.
Note: Monitor the price action around 4063 carefully, as it is a crucial resistance level.
📉Bearish Scenario
Entry: First trigger at 3719 (risky), main entry on a break below 3652.
Target: Following a break below 3652, look for confirmation of bearish momentum with a break below 41.03 on the RSI.
Short Position
Primary Trigger: Break below 3652.
Secondary Trigger: For a riskier entry, consider 3719, but the main focus should be on 3652.
RSI Confirmation: A break below 41.03 would confirm bearish momentum.
📝Ethereum is currently in a consolidation phase with key support at 3652 and resistances at 3960 and 4063. The low volume suggests that a significant move could be imminent. Traders should watch for breaks of these critical levels to enter positions, with volume and RSI serving as additional confirmation indicators. Always keep an eye on market conditions and adjust positions accordingly.
🧠💼It's important to acknowledge the inherent risks in futures trading, with the potential for margin calls if risk management is neglected. Always adhere to strict capital management principles and utilize stop-loss orders, ensuring that the initial target offers a risk-to-reward ratio of 2.
🫶If you enjoyed this analysis and want to support me, please boost this analysis. Feel free to leave a comment or suggest a coin you'd like me to analyze next.

ETH Price The Ethereum (ETH) coin has picked strength and is on the verge to trigger a massive blast.

Ethereum Let's go for Ethereum $4000 or Ethereum $3500!!?
what do you think?
We have HH and HL on the chart so far; In other words, we do not have confirmation for a downward trend (((currently))). The resistance range that we had on the price area of $3943 has also been completely consumed.
As the resistance areas are consumed, the way to continue the upward trend is opened.
Now, on the price chart, a compression movement has been formed in the 30-minute time frame; Provided that the price range of $3,628 is maintained, there is a high possibility that we will get out of this compression from above.
But we have to be careful, the possibility of getting out of this compression from the bottom is not small. Especially since currently 68% of Ethereum holders are in profit.

ETH in 4h time frameI imagine such a movement for Ethereum in the coming days. A side trend between prices of 3500 and 4900 dollars..

ETHUSDT, falling after bulls distributedHi,
In previous idea i mistake with bulls correction. After 4H timeframe was analyse its clear bearish tendention after big bulls volume was distributed. Bears target 3539 - strong 4H X-Lines level. Support me.

#ETH has a chance to form a bearish head and shoulders📊#ETH has a chance to form a bearish head and shoulders📉
🧠We have been consolidating within the target zone after achieving our daily long target. From a structural point of view, we have the opportunity to build a bearish head and shoulders structure. A break below the uptrend support line 1 increases the probability of a bearish head and shoulders. After breaking below inflection point 1, a bearish head and shoulders is established.✔️
🔥If this bearish structure holds true, then the short target area we will first focus on is around 3321-3365🎯
Don’t forget risk management💯
✔️Trade safe✔️
🤜If you like my analysis, please like 💖and share it
👋follow me. Learn about further structural evolution💕
BINANCE:ETHUSDT.P

Eth Pump soon $3900Waiting for Eth confirmation to long.
Inverse head and shoulder
4hr 50 ema bounce
Attempting 1hr - 4hr bullish trend shift
Daily and weekly bullish
Waiting for retest entry.

ETH: Approaching SupportTrade setup : Price is in an Uptrend. Following a bullish breakout from a Descending Triangle pattern, price spiked up 25% and reached our near-term target of $4K. However, it got overbought (RSI ~ 70) and is pulling back on some profit taking.
Now we look for the right entry opportunity in Uptrend. We wait for price to either 1) break above $4K to signal continuation of uptrend, with +17% upside potential to its ATH of $4,700, or 2) pull back near $3,200 support for another swing trade entry in Uptrend with upside potential back to $4K. Learn to trade chart patterns in Lesson 8 and set Stop Loss levels in Lesson 9.
Pattern : Price is Approaching Support , which is a level where it could pause or reverse its recent decline, at least temporarily. Support is often a level where price has bounced up in the past, or potentially prior Resistance level that was broken. (concept known as polarity). Once price breaks below support, it can move lower to the next support level. Learn to trade key levels in Lesson 7.
Trend : Short-term trend is Up, Medium-term trend is Strong Up and Long-term trend is Up.
Momentum is Bullish but inflecting. MACD Line is still above MACD Signal Line but momentum may have peaked since MACD Histogram bars are declining, which suggests that momentum could be nearing a downswing. Price is neither overbought nor oversold currently, based on RSI-14 levels (RSI > 30 and RSI < 70).
Support and Resistance : Nearest Support Zone is $3,200.00, then $2,930.00. Nearest Resistance Zone is $4,000.00, then $4,800.00.

High probability of ATH breakEthereum on the monthly timeframe shows a strong engulfing candle, confirming the strength of the upward trend with its close. Ethereum has a key support level at $3500. This support level can serve as the starting point for a new upward leg towards the previous all-time high (ATH) after completing its pullback. From a technical analysis perspective, if the $3500 support level holds and bullish patterns continue, there is a high probability of breaking the previous ATH and continuing the upward trend.

What do Ethereum fans think ? TM : 1hHello dear traders. You can see two areas on the chart, you can enter the position depending on the sale and buy area. And I made a serious decision to share the important areas of my personal strategy for free if supported.

ETH monthly bullishAs, new month starts as per monthly analysis. Engulfing candle pattern formed. It can come to test FIB gold zone in this month. but looks promising for long my idea wait for monthly breakout or wait for FIB testing zone. but I will go long after this two confirmation. top of last bull run tradeline breakout retest and after this engulfing is created. Let's wait for the best don't forget to go long.

ETH/USDT 4HOUR CHART UYPDATE Hello friends, welcome to this ETH update from Crypto Sanders.
ETH/USDT Brief Update
Ethereum (ETH) is currently trading within a head and shoulders pattern on the 4-hour timeframe, as seen in the chart. Here are the key points:
ETH is showing a head and shoulders formation, which typically signals a potential bearish reversal.
Resistance and Support:
Around $3,950 to $4,000 (highlighted by the left and right shoulders).
Close to $3,640 (lower boundary of the pattern).
A breakout above the right shoulder (~$3,850) could lead to further gains.
A breakdown below the support level (~$3,640) would confirm the head and shoulders pattern, which signals a potential decline.
Monitor the $3,850 resistance level for signs of a breakout.
Keep an eye on a potential breakdown below $3,640 for bearish confirmation.
Stay tuned for further updates and analysis!
I have tried to bring the best possible results in this chart.
If you like it, hit the like button and share your charts in the comments section.
Thank you.

ETH fighting against strong resistanceHello everyone, let's take a look at the ETH to USDT chart on a one-day time frame. As you can see, the price is currently bouncing off the downtrend line.
Let's start by determining the support line and as you can see, the first support in the near future is $3,530, then you can see support at $3,250, and then we have a strong support zone from $3,046 to $2,796
Now let's move on to determining the resistance points. And here we must start by identifying a very strong resistance zone from $3,821 to $4,110, only when we manage to break out and positively test this zone, we can see a move towards the resistance at $4,917.
Looking at the EMA Cross 50 and 200 indicator, they still indicate that the strong upward trend is maintained.
There is still room for growth on the RSI indicator, while the STOCH indicator shows a move towards the upper limit, so you should be careful and take into account a possible recovery.

ETH - wait for entry
I'm waiting for ETH to go a little bit lower to enter.
My plan is as in chart.
Disclaimer:
This analysis is based on my personnal views and is not a financial advice. Risk is under your control.

Quick Bitcoin Update - 31 May 2024Hello Traders,
Checkout the latest update on Bitcoin and Eth. Still trading in range and we might see small liquidations

ETH Poised for Post-ETF Approval Pullback: Short to 3.2k ZoneEthereum surged over 30% in anticipation of its much-awaited ETF approval, but the excitement may be short-lived. As traders who missed the initial rally eye the $2.9k to $3.2k support zone, a pullback seems likely. With ETH currently trading around $3.8k, a short trade to this support area presents an attractive opportunity.
Technical Analysis:
Visible Range Volume Profile (VRVP): The VRVP indicates a significant volume zone at $3k, suggesting strong support at this level.
Average Directional Index (ADX): The ADX, a momentum indicator, is losing strength, signaling a weakening trend.
Proposed Short Trade:
Entry Price: 3.8k zone USDT
Take Profit: 3k zone USDT
Stop Loss: 4.110 USDT
Rationale:
The post-ETF approval euphoria is likely to fade, leading to a price correction.
The $2.9k to $3.2k zone represents a strong support area, as evidenced by the VRVP.
The weakening ADX suggests a loss of momentum in the uptrend.
Risk-to-Reward Ratio:
The potential risk-to-reward ratio for this trade is approximately 3:1, implying a potential 3% profit for every 1% risk.

Ethereum Daily FibonacciEthereum daily Fibonacci, the main target is a decline and correction to the price of 0.618~0.5, it is only a matter of time before it reaches that level.
