FDXM1! trade ideas

1hour chartfrom 9Nov dax is range , still buyer pressure is high,,,i can see dax can fly to up ,go to new level 14000 to 17000
wait until donchian up,down line break

DAILY CHART 13800 IS TARGET BE CAREFUL , FIBO EXTENTION SHOW DAX WILL SEE 17000 SOON
SECRET= WHEN DAX IS ABOVE EMA200 60MIN,DAILY ONLY LOOKING FOR BUY,BUYSTOP ON HIGH
100% put buylimit on 12600 too

down gap fillin up we have =gap +all time high +trendline in 13800
trend still is powerful + ,looking for buystop in 15min high

FDAX MFI OversoldThat means a bounce, no wonder why we're getting a bullish finish on a Thu which is usually the weakest day.

Getting into the Value Zone of the vol. profileThe price come back to the value zone, breaking down the VAH. Target is to reach the VAL (volume low).

why 14400 is dax targetfibo extention and fibo show high will be 14400 then 16000
be careful from sell, dont remove sl....looking for buystop on 15min high (when dax is above ema200 60-1440min)

dax is range from 8 days agstrategy = on dax when you see range (low move) 100% put buystop on high,sellstop low you must see 3sl 7tp (tp=3*sl)

trend push dax up dax traders in war to reach all time high(13800) so
sellimit below 13800 and buylimit on down 2 gap is good orders (sl=40) trail stop=40)

FDAX UpdateRSI overbought but MFI isn;'t. Looks bullish like it wants to fill teh original COVID gap from Feb.
If FDAX goes up, the market usually gaps up. The only reason why some indices are red is because Asia dropped yesterday.

AC 240min show + trend to 14000on dax AC (or stoch 5-3-3) is important time=30-240
on gold=60-1440min
golden buylimit for keep longterm=12540

Downmove potential on DAXThese are the latest potentials I see after analyzing with volumes and market orders.
My settings for DAX is still short above 13000.
Happy trading!

FDAX Gap FillBefore people get too bearish because the market is overly pumptarded, a reminder that a few indices have yet to fill the original COVID gap.... and now we have 3 vaccines.
FDAX/iBov (Brazil)/HangSeng (Hong Kong) still need to filll COVID gaps.
Odly, FDAX has a gap underneath as well, so eventually the market will tank. But who knows when.....

DAX pointing to highs.In my previous charts analysis, we were subjected to two conditions, big ones. Now they cleared up. US elections happened, market seemed to take it okay, and vaccine trials from different labs are promising good results and deliveries might be happening before EOD. All this plus pure technical analysis made it clear for me: LONG.
I'm chasing 460 area, and above that we can easily finish the year above 600.

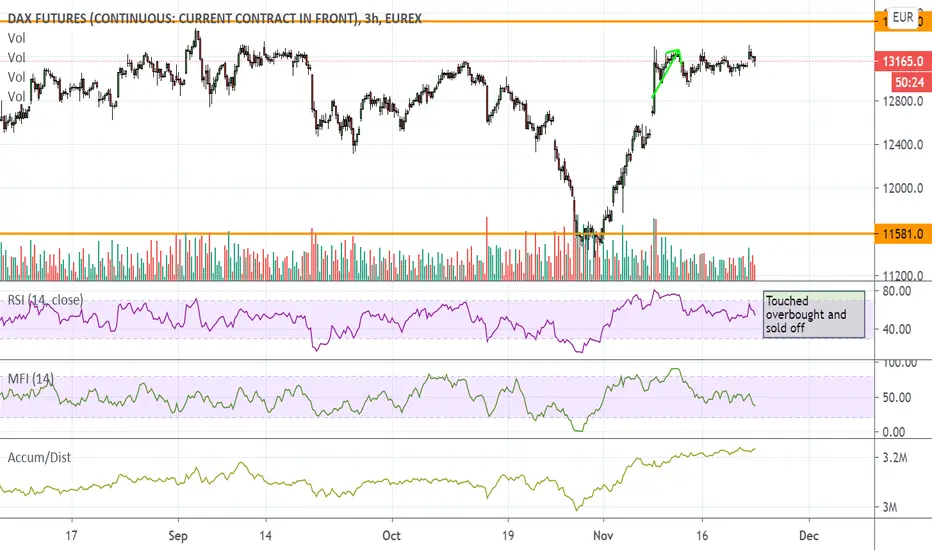
FDAX UpdateFDAX went overbought on RSI this morning and dumped, hence the weakness in the morning. QQQ and SPY both went red.
Just because the market is pumptarded doesn't mean it's gonna gap up tomorrow. Could go either way since Europe looked weak. Note that MFI is droppping as well.
buystop on up,sellstop in low with sl=40 point(400)
we are in low range days, brek up can move dax to 13800 then 14400 (sellimit on it)
if down break dax will fill gap then pull back up or fibo 61%

FDAX GapfillThe morning gap s dictated by the EUros, so the question is which way is FDAX going?
Gap below, and the original COVID gap still above. Gonna fill one gap or the other. I think it fills the one below first, but we'll see.
Indicators in the middle, no clear direction.
DAX still looking for a correction (when buy? when sell?)In my opinion, DAX is still overheated through the latest vaccine news. Looking at the daily chart, you see lots of impatience.
A correction is more than likely to happen with DOJI candles at the top. The fundamentals don't really point in the direction of an ongoing rally. During the Corona crisis, the most accepted value was 12640.
The area between 12800 and 12640 would be for me a fair price in relation to the current situation.
You can see this chart as a confirmation of your own settings.
Take care about not getting stopped out, look for a good money and risk management as always and happy trading!

SUPER RANGE DAYS after pfizer news up explode , we are in very low movment , be careful dax can explode , so when dax is range put buystop,sell stop on it with trail stop 40 !!!

FDAX Bedtime UpdateFutures only slightly red, the big question is which way Europe goes in the morning.
Indicators are all in the middle but trending down. Could still go either way.

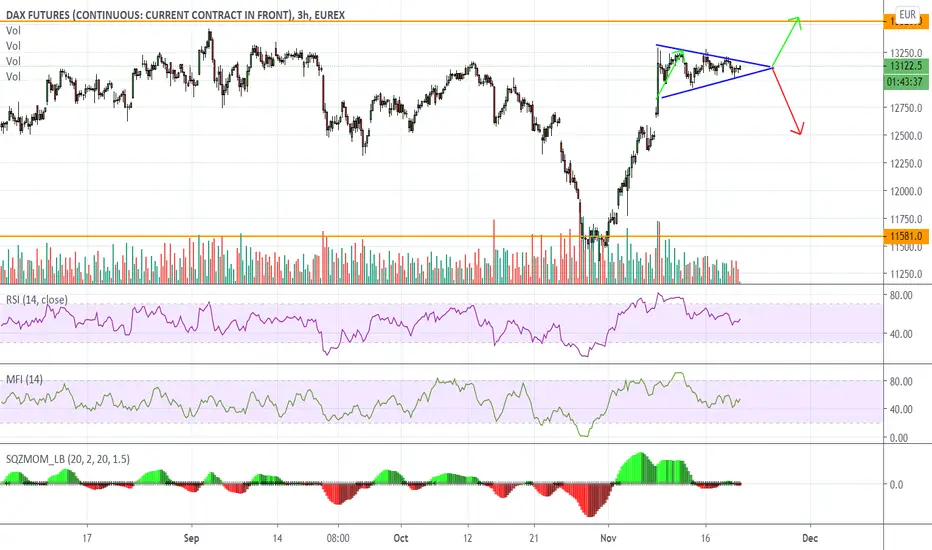
DAX Is Bullish, But More Gains After A Short-Term PullbackHello traders!
DAX made nice and impulsive bounce from projected support after we noticed a three-wave A-B-C corrective decline, so it's turning back to a bullish mode, mainly because of recent break above trendline.
However, watch out for a temporary short-term pullback to fill that open GAP, which can actually retest that daily trendline with potential support around 12300 level. In fact, if current 13300/13400 zone will also hold as a resistance, then we may see a potential inverted H&S pattern, where right shoulder is still missing.
Trade well!
If you like what we do, then please like and share the idea.
Disclosure: Please be informed that information we provide is NOT a trading recommendation or investment advice. All of our work is for educational purposes only.

up gap or down gapafter huge up move , we are in range days ,can take 1 week
according AC240 min , 80% up gap will fill so put buystop on high with sl=40
if you have open sell ,close it , dax can see 14400 according fibo etention
note=12900 have powerful buylimit too , with tp=13800

DAX: New All-time High Coming Soon? 🚀Hello guys,
today I am going to focus on a long-term analysis of DAX.
DAX is a stock index which consists of the 30 biggest companies listed on the Frankfurt Stock Exchange. It does not represent just those 30, but the whole German industry as also other German companies, and their stocks are very tightly knit with DAX.
Simply put – if DAX goes down, then the majority of German companies go down as well (not just the 30).
Price Action analysis
Let’s start with a simple Price Action analysis. In here, I will focus only on one thing – comparing strength of Buyers with the strength of Sellers. This could give us an idea of where DAX could be heading next!
What matters the most is the aggressivity of Buyers vs. Sellers.
Aggressive Buyers or Sellers create strong trends and strong rejections of higher or lower prices.
Let’s have a look at the chart below. In there, I compared aggressivity of Buyers (blue) vs. Sellers (red).
BUYERS:
There are two very strong rejections of lower prices.
The first one is actually super-strong rejection. There was a crazy sell-off but then the Buyers were able to turn the price and push it all the way back where it was before.
The second rejection is also pretty strong and sharp. It occurred only a few days back. It also represents strong and aggressive Buyers who rejected the lower prices.
SELLERS:
So, what about sellers? There was this crazy strong sell-off in February and March, but it already got completely “covered” by Buyers. Those basically negated this whole move.
After that, there was no sign of strong selling activity.
What we see are only “weak highs” – and the price likes to test those!
BUYERS vs SELLERS:
To me, the picture below gives me a clear message: There are strong Buyers and weak Sellers.
The all-time high on DAX is weak and therefore the price is likely to test it and push the price above it. To create a new all-time high!
Volume Profile analysis
Let’s now have a look at some volume-based Supports on DAX!
I used my Volume Profile to look into this rejection to see how the volumes were distributed there.
The Volume Profile shows three important zones that got created in the strong rejection of lower prices.
In all three areas there were heavy volumes traded. Those volumes were most likely volumes of strong Buyers who were adding to their Long positions as they were pushing the price upwards.
Those zones are important for those Buyers and therefore they should work as strong supports. When the price makes it back there at some point in the future those buyers are likely to become active and defend those areas.
The heaviest volumes within the rejection got traded around: 10.550; 9.630; and 9.100. Those are currently the strongest volume-based Supports on DAX.
In my opinion, the strongest one of them is the first one (10.550). The reason is that the heaviest volumes were traded, there and also that a strong buying activity starts from there. As a bonus, the pinbar right before the strong buying activity started to continue also adds to the strength of this support.
I hope you guys liked this analysis. Let me know what you think in the comments below.
Happy trading!
-Dale
