BUY EURUSDToday we are monitoring EURUSD for bullish pullback. Entry at 1.0732 target 1.0807 and stop below 1.0708. Use proper risk management.
EURUSD trade ideas

Bearish drop?EUR/USD is rising towards a resistance level which is a pullback resistance that is slightly below the 38.2% Fibonacci retracement and could reverse from this level to our take profit.
Entry: 1.07268
Why we like it:
There is a pullback resistance level that is slightly below the 38.2% Fibonacci retracement.
Stop loss: 1.07750
Why we like it:
There is a pullback resistance level which aligns with the 61.8% Fibonacci retracement.
Take profit: 1.06504
Why we like it:
There is a pullback support level.
Please be advised that the information presented on TradingView is provided to Vantage (‘Vantage Global Limited’, ‘we’) by a third-party provider (‘Everest Fortune Group’). Please be reminded that you are solely responsible for the trading decisions on your account. There is a very high degree of risk involved in trading. Any information and/or content is intended entirely for research, educational and informational purposes only and does not constitute investment or consultation advice or investment strategy. The information is not tailored to the investment needs of any specific person and therefore does not involve a consideration of any of the investment objectives, financial situation or needs of any viewer that may receive it. Kindly also note that past performance is not a reliable indicator of future results. Actual results may differ materially from those anticipated in forward-looking or past performance statements. We assume no liability as to the accuracy or completeness of any of the information and/or content provided herein and the Company cannot be held responsible for any omission, mistake nor for any loss or damage including without limitation to any loss of profit which may arise from reliance on any information supplied by Everest Fortune Group.

EURUSD EFFORTS TO RECOVER FROM LOSS...Dear Traders,As you know after wednesday EUR/USD retreated and recorded large dump on thersday
Over All EURUSD Outlook from the market remains bearish as the pair continues to trade in a tightening wedge pattren
Bht we Accepts That in short term,Eurusd Will Still Recieve Good Support with aim Of Reaching To the resistance level.
Resistance -1.0770-10775
Will Fly Befor Falling Deeeper According to the Outlook.

EURUSD analysis week 27📌EUR/USD continued to slide to Friday's lows, falling to 1.0670 before recovering to 1.0700 during the US market session. Political pressure is weighing on the Euro after a major change in European voter sentiment.
📌On the US side, increasingly negative data is raising concerns about a possible recession, fueled by the results of the University of Michigan (UoM) consumer sentiment survey. worse than expected.
📌The currency pair is trading far away from the EMA 34 and EMA 89, showing that there has been instability in the pair over the past week. The downtrend is clearly established as the key support zone of 1,073 was broken and created a bearish Dow pattern. The pair's narrow trading range was formed at 1,070 and 1,076. When the market fluctuates strongly due to news of important resistance and support areas next week, investors can pay attention to the port areas of 1,061 and 1,080.
Trading signals
BUY EURUSD zone 1.06200-1.06000 SL 1.065800
SELL EURUSD zone 1.08000-1.08200 SL 1.08400
Support: 1.062 - 1.070
Resistance: 1.076 - 1.080

EURUSD / Bullish Trend Above 1.0740 with Key Levels to WatchEUR/USD Outlook
Current Outlook:
The price is expected to trade in the bullish zone, having reversed and stabilized above the pivot zone.
Bearish Scenario:
The price would need to reverse and stabilize below 1.0707 to initiate a bearish trend.
Bullish Scenario:
As long as the price remains above 1.0740, the bullish trend is expected to continue, targeting 1.0796.
Key Levels:
- Pivot Line: 1.0740
- Support Levels: 1.0680, 1.0620, 1.0505
- Resistance Levels: 1.0796, 1.0850, 1.0915
Expected Trading Range:
The price is anticipated to move between the resistance at 1.0796 and the support at 1.0707.
In summary, maintaining a position above 1.0740 supports a bullish outlook, aiming for higher resistance levels. Conversely, trading below 1.0707 indicates a bearish trend with potential support targets.

EUR/USD Gains Momentum Ahead of US Core Retail Sales Data ReleasThe EUR/USD pair is trading higher on Tuesday, following a pullback to the support level at 1.06690, which coincides with the 78.6% Fibonacci retracement from the previous swing low. This support area has provided a strong foundation for the pair, allowing it to gain upward momentum.
Traders are closely monitoring the upcoming US Retail Sales data, particularly the Core Retail Sales m/m figures, which are expected to be a significant catalyst for further movement in the EUR/USD pair. Positive data could push the pair even higher, as it would indicate stronger consumer spending in the US, potentially leading to a stronger US Dollar. However, any signs of weaker data could bolster the Euro further, as traders anticipate a less aggressive stance from the Federal Reserve.
Adding to the bullish outlook, there is a noticeable divergence on the H4 timeframe's stochastic indicator. Divergence occurs when the price movement of the currency pair contrasts with the indicator, often signaling a potential reversal or strengthening of the current trend. In this case, the stochastic divergence suggests that the upward movement of the EUR/USD pair could gain more traction.
Institutional traders also seem to be favoring the Euro over the US Dollar. Reports indicate a significant increase in long positions on the Euro, reflecting a broader sentiment shift among large market participants. This institutional support adds further credibility to the potential for continued upward movement in the EUR/USD pair.
In summary, the EUR/USD pair is showing promising signs of a bullish continuation after rebounding from a key support level and the 78.6% Fibonacci retracement. With the upcoming US Retail Sales data and technical indicators aligning in favor of the Euro, traders have a reason to anticipate further gains. The increased long positions by institutional traders further reinforce this positive outlook, suggesting that the pair could see sustained upward momentum in the near term.

EURUSD continuationEU short on the radar. Daily trend is still overall bearish and watching to see if we make short-term lower lows on the 1H timeframe. Should we get a clear break and retest as shown , can expect this to take us to the next support marked.

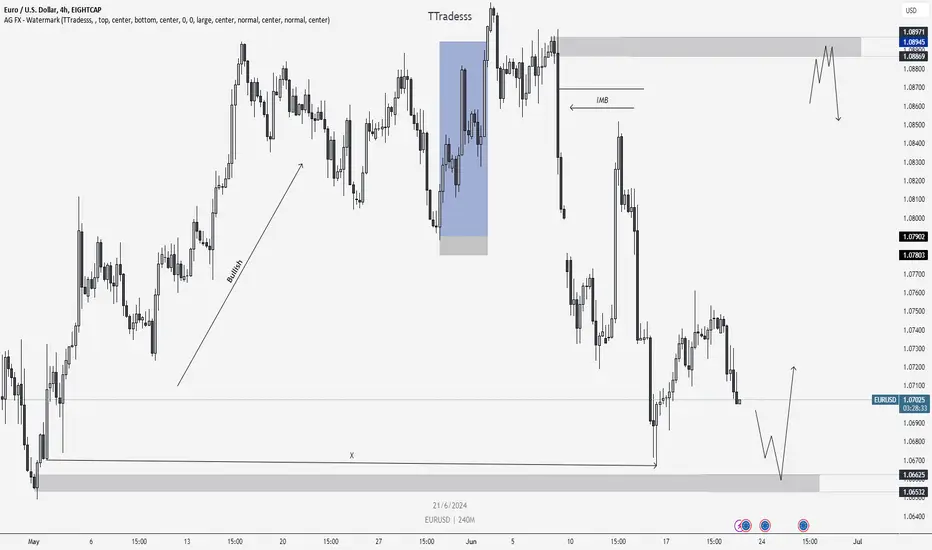
CHART BREAKDOWN EURUSD: Key Levels, Targets and Thoughts!Brief Description🖊️:
The chart provides insights into critical market levels, emphasizing an essential demand zone (low-risk buy zone) spanning from 1.0653 to 1.0662. Additionally, a low-risk sell zone between 1.0887 to 1.0897, respectively, is highlighted.
Things I Have Seen👀:
Important Supply Zone🟢: Identified between 1.0887 to 1.0897, serving as a low-risk sell.
Important Demand Zone🟢: Identified between 1.0653 to 1.0662, serving as a low-risk buy.
Bullish Targets📈:
1.0720: Possible retracement area.
1.0730: Possible retracement area.
1.0760: Possible retracement area.
1.0810: Possible retracement area.
1.0840: Possible retracement area.
1.0887: Significant supply zone.
1.0910: Liquidity area.
Bearish Targets📉:
1.0840: Possible retracement area.
1.0810: Possible retracement area.
1.0760: Possible retracement area.
1.0730: Possible retracement area.
1.0720: Possible retracement area.
1.0662: Essential Demand Zone
Ultimate Target: 1.0650- Laying Low Liquidity
What's Important Now❗
Currently, the crucial approach is to wait and observe the price action at this level. We need to assess how the market reacts before considering any decisive moves. Stay observant and responsive to real-time developments in the market.
EURUSD:: IntradayBy taking a deeper look at Daily chart we could easily see a bearish move!
Latest reaction was to top of the channel an we are going to reach to bottom of the channel. However, We see the RSI is forming a trend line which seems hard to be broken down. I think we could see a reversal to MA of RSI. So we might have one or two range days. Therefore we are both ready for Bearish and range days.
By taking a look to 1h chart we could see that a great zone to short the pair is available!
However by breaking the 1.0770 we could consider the trend bullish.
What is obvious in the main chart is that today Fibonacci R1 is in coincide with yesterday Pivot and these two are perfectly in our zone!
I'm waiting to sell from there! the channel in 15m chart could be used as liquidity hunt! These are important levels of today you can search for more reasons or places to short the pair

Its destined for the dump small pullback and down we goWe are going down IFVG and OB are resistance levels.
Always follow these rules
- Accumulation / Manipulation / Distribution
- No liquidity raid = No trade
- Never buy high and never sell low
“Adapt what is useful, reject what is useless, and add what is specifically your own.”
Dave FX Hunter ⚔

EUR USD PRICE - GET READY TO FLY UP SIDE HERE we can see that price moving in a downward direction, waiting for breakout, make a long entry after retest.. follow for more live updates...

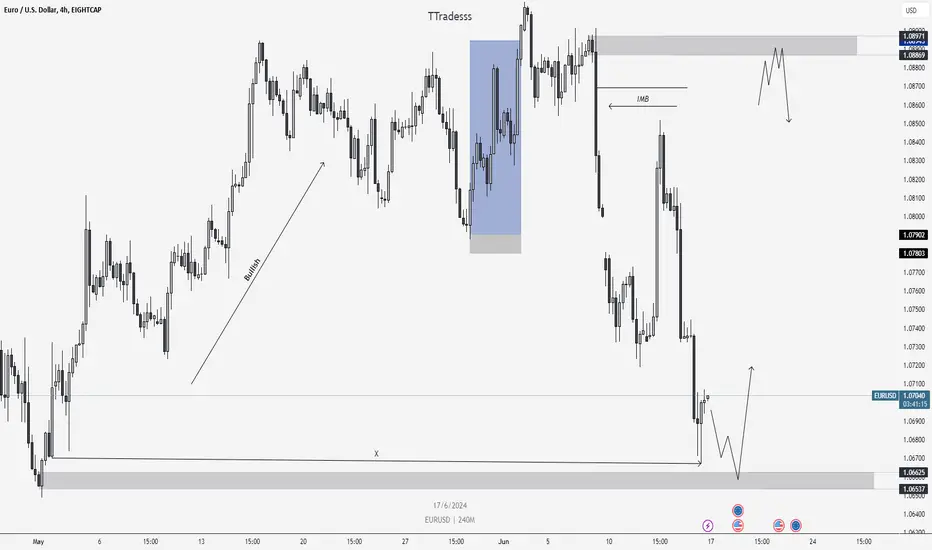
CHART BREAKDOWN EURUSD: Key Levels, Targets and Thoughts!Brief Description🖊️:
The chart provides insights into critical market levels, emphasizing an essential demand zone (low-risk buy zone) spanning from 1.0653 to 1.0662. Additionally, a low-risk sell zone between 1.0887 to 1.0897, respectively, is highlighted.
Things I Have Seen👀:
Important Supply Zone🟢: Identified between 1.0887 to 1.0897, serving as a low-risk sell.
Important Demand Zone🟢: Identified between 1.0653 to 1.0662, serving as a low-risk buy.
Bullish Targets📈:
1.0720: Possible retracement area.
1.0730: Possible retracement area.
1.0760: Possible retracement area.
1.0810: Possible retracement area.
1.0840: Possible retracement area.
1.0887: Significant supply zone.
1.0910: Liquidity area.
Bearish Targets📉:
1.0840: Possible retracement area.
1.0810: Possible retracement area.
1.0760: Possible retracement area.
1.0730: Possible retracement area.
1.0720: Possible retracement area.
1.0662: Essential Demand Zone
Ultimate Target: 1.0650- Laying Low Liquidity
What's Important Now❗
Currently, the crucial approach is to wait and observe the price action at this level. We need to assess how the market reacts before considering any decisive moves. Stay observant and responsive to real-time developments in the market.
EURUSD Double BottomYou will never see another double bottom as beautiful as this. Buy to the top. Goodluck

EURUSD: still no cutThe major event during the previous week was the FOMC meeting, where its members were deciding on the course of the US reference interest rates. The rates were left unchanged, which was widely expected by market participants, but what the market could not anticipate is that the Fed cut their interest rate projections till the end of this year, and from initially expected three rate cuts, the Fed is now projecting only one later this year. This information was crucial for the markets to start their re-positioning, which implied extreme volatility in prices of equities, Treasury bonds, and gold on Wednesday, while the US Dollar also had its strong shifts. Before the FOMC meeting, the latest US inflation data was published. Inflation rate in May was standing at the level of 3.3% y/y, which was lower from the market forecast of 3.4%. Core inflation rate also slowed down to the level of 3.4% y/y, again lower from market forecast of 3.5%. As for other US macro data released during the week, Producers Price Index was down by -0.2% m/m in May, lower from forecasted +0.1%. Initial Jobless Claims in June were standing at 242K, missing market estimate of 225K. Michigan Consumer Sentiment preliminary for June was 65.6, much lower from the market estimate at 72.
Inflation rate in Germany final for May, was standing at 2.4% y/y, without a change from a previous post. There have not been further significant macro data published for the Euro Zone and Germany, as its strongest economy.
Fed-induced volatility has been dominant on the eurusd market during the previous week. The currency pair had its own strong swifts toward both sides, as the market initially was not sure which side to trade. In this sense, the range in which eurusd was traded was wide between levels of 1.085 down to 1.067. Still, the currency pair is ending the week at the level of 1.07. The RSI is on its clear path toward the oversold side, however, it will need some more time until the clear oversold momentum is reached, considering that it is currently moving around the level of 38. Moving averages of 50 and 200 days continue to move as two parallel lines still, without an indication of a potential cross.
Two weeks ago charts were clearly indicating that the next target of eurusd might be long term support at 1.067. Although it should have happened within a longer period of time, still, the market decided to test this level during the previous week. However, it was clear that this support will not be reached until 1.07 is clearly tested, so it could be expected that the market will spend a week ahead testing these levels. At this moment, there is an extremely low probability that 1.08 could be reached for one more time. Charts are indicating that the week ahead might be a bearish one for the currency pair.
Important news to watch during the week ahead are:
Euro: Core Inflation Rate final for May in Euro Zone, ZEW Economic Sentiment Index for June for the Euro Zone and Germany, HCOB Manufacturing PMI flash for June for Germany,
USD: Retail Sales in May, Building Permits preliminary for May

EUR/USD Outlook ICT Concepts💰 Welcome to Your Channel!
Welcome to our channel where we delve into the intricacies of financial markets. Today, we focus on EUR/USD , dissecting its current price action to uncover strategic trading opportunities. Join us as we analyze key levels and market dynamics, aiming to refine our trading strategies and maximize potential gains.
📈 Anticipated Price Retracement
In our previous EUR analysis, we projected a price retracement to mitigate inefficiencies, including Gaps and Fair Value Gaps ( FVG ). This forecast materialized, with a notable reaction at the FVG created post-Market Structure Shift ( MSS ).
📉 Expansion and Sell-Side Liquidity
Subsequently, the price extended lower, targeting and absorbing the sell-side liquidity ( SSL ). Our analysis had delineated Optimal Trade Entry ( OTE ) levels, which the price action respected, exemplifying an optimal scenario.
🔄 Reaction to Fair Value Gap
Presently, the price has retraced to the delineated FVG, exhibiting a significant reaction at the 50% (CE) level of the FVG . This movement also induced a Smart Money Technique ( SMT ) divergence with GBP/USD .
🧠 Understanding Smart Money Technique (SMT)
You may inquire about SMT: in this context, SMT manifests when EUR registers a high, fails to achieve a higher high, and instead forms a lower high, whereas GBP/USD attains a higher high. This divergence signifies a bearish SMT , particularly when aligned with existing inefficiencies (FVG).
🔍 Outlook: Bearish or Bullish?
To consider a bullish scenario, the price must invalidate the SMT. Should the SMT persist, our stance remains bearish until pivotal levels, such as the Previous Week Low ( PWL ), are achieved.
🙏 Thank you for joining us!
Exploring EUR/USD today highlighted the importance of effective risk management in trading success. Prioritize research, implement robust strategies, and seek guidance for confident market navigation. Stay tuned for more insights on our channel. Here's to profitable trading and continuous learning!
⚠️ Disclaimer
The information provided here is for educational purposes only and should not be taken as financial advice. Always conduct your own research and consult a licensed financial advisor before making any investment decisions.

best time to buy??the best time to buy is at 3rd entry, because the size between entry level and cut loss level is just very small risk. i can see the uptrend behavior from uptrend trendline that i drawn.. so what ever it is TRADE AT YOUR OWN RISK

EURUSD Daily Plan - LONGThat's my daily plan for tomorrow on EURUSD. I expect a range in the Asian session that could lead in a drop in the beginning of the London. Not sure about the London, but i will look for longs to hold till the first target area at 1.08

EURUSD fell through all three simple moving averagesEUR/USD fell through all three simple moving averages and prior horizontal support in early trade before finding stability around 1.0750. The next level of support is seen just below 1.0700.

EURUSD attempts to hold 1.0700OANDA:EURUSD ANALYSIS
- Focus returns to Europe and France in particular in the lead up to the elections
- Will the ECB step in to calm widening bond spreads considering Frances debt load?
- EUR/USD fails to capitalize on Mondays reprieve – downside risks remain
WILL THE ECB STEP IN TO CALM WIDENING BOND SPREADS CONSIDERING FRANCE'S DEBT LOAD?
With the focus shifting back to Europe, particularly France, the campaign for the upcoming parliamentary elections is in full swing. The rising popularity of Marine Le Pen's National Rally party has concerned markets, as they see it as a potential unpredictable force impacting European bond markets. The risk premium applied to riskier nations like Italy and France is reflected in the French-German spreads, while investors have turned to safer German bonds. Keep an eye on any sell-off in periphery nations' bonds as it could lead to a weaker euro when France goes to vote.
The ECB's Chief Economist, Philip Lane, described the recent bond market movement as "repricing" and not chaotic. The ECB introduced a new tool to address any potential fragmentation in the bond market in 2022, which involves purchasing bonds from qualifying member states if borrowing costs become uncontrollable. France's debt to GDP ratio is currently above the EU's recommended 60%, which may complicate their eligibility for assistance if spreads get out of control.
OANDA:EURUSD ATTEMPTS TO HOLD 1.0700 BUT DOWNSIDE RISKS REMAIN
On Monday, the pair attempted to break through the 1.0700 level, but concerns about momentum and downside risks persist. The price is currently trading below the 200 simple moving average and is likely to retest 1.0700. Key support levels are at 1.0600 and potentially even 1.0450, which was the low point of the major decline in 2023.
EU inflation data has been declining despite a slight increase in May. The ECB is considering another interest rate cut. Today, ZEW economic sentiment fell short of expectations at 47.5 (slightly better than last month's 47.1). Inflation expectations have increased due to the slightly higher May figures.

A Trading Plan Is Important For Success - Here Is MineIn this video we take a look at a trend continuation trading strategy. I explain my approach to trading how I identify a trend and what I look for for high probability trade opportunities. As always the information is for educational purposes only and not to be construed as financial advice.

EURUSD strategy: Should Buy or Sell !On Wednesday, EUR/USD experienced an uptick as the U.S. markets took a mid-week holiday break. As we move into the second half of the trading week, investors are looking ahead to the Friday PMI data for meaningful insights that could steer market sentiment.
Despite the recent recovery, uncertainty lingers. The pair is still facing significant resistance and a downward trendline. Keep an eye on these levels – if EUR/USD breaks through the resistance, a buying opportunity could emerge. Conversely, if the resistance holds, selling might be the better strategy.
Stay tuned and watch those key levels closely!

EURUSD ended the session but the price still decreasedEURUSD continued its downward trend during the final session of Friday, forming a "cup and handle" pattern on the 1-hour chart with consolidation around the 1.069 level. The outlook remains bearish following the completion of this pattern and a breach below the support level at 1.067.

EURUSD Bearish move continued**Monthly Chart**
EURUSD is in a large range between 1.11500 and 1.04482 levels from August 2023 to date as per the monthly chart. However, it is still moving in a large long-term bearish directional bias and short-term bullish directional bias.
**Weekly Chart**
EURUSD weekly candle closed bearish after testing 50% of the previous weekly candle and moved lower in addition to filling the gap that occurred during the weekend due to the EURO election. This provided a clear indication to continue the move lower this week. The next target is around 1.0600 level (the previous weekly swing low).
**Daily Chart**
The gap was filled just before FOMC announcement last Wednesday, which created a favorable spot to push EURUSD lower. On 21st June there will be EURO PMI results which might generate some reaction near 1.06000 level. We will be looking to short this pair if there is a good pullback with a clear confirmation pattern on lower time frame. The first target will be 1.06000 level and then 1.0500/1.04500 levels. However, we might expect a reaction around 1.0600 level that may push the price higher.
