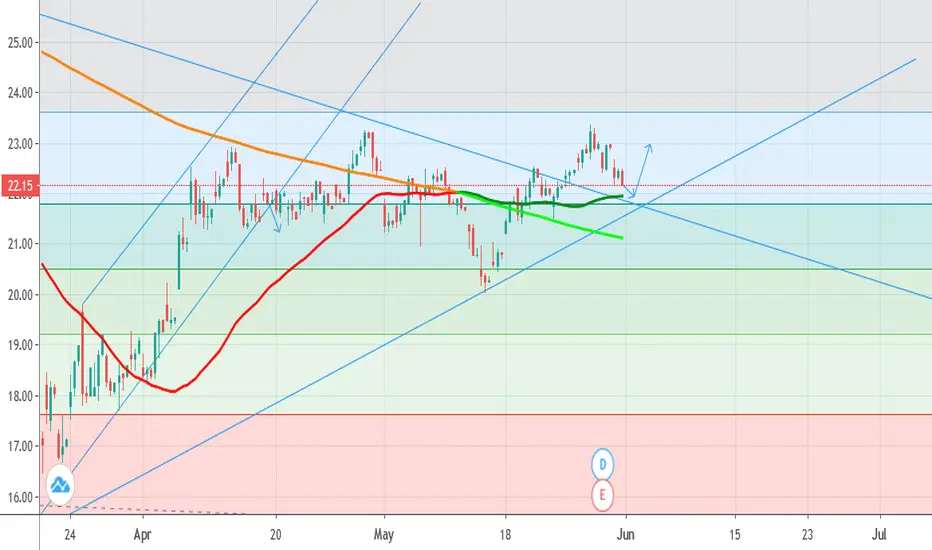
Just a thought about how things will go, judging by historyI don't have much to say about what we see here. In my perspective, there appears to be a bearish flag forming, indicating a potential downward trend. Additionally, considering the previous spark in RSI and the confirmation by MACD, I believe we now have a second signal suggesting further price decl
Next report date
Report period
Q1 2024
EPS estimate
0.35USD
Revenue estimate
4.17 BUSD
−1.10USD
−513.24 MUSD
16.85 BUSD
176.72 M
About EVONIK INDUSTRIES AG
Sector
CEO
Christian Kullmann
Headquarters
Essen
Website
Employees (FY)
33.41 K
Founded
2006
ISIN
DE000EVNK013
FIGI
BBG004TRXC16
Evonik Industries AG operates as a holding company, which engages in the manufacture of specialty chemical products. It operates through the following segments: Specialty Aditives, Nutrition & Care, Smart Materials, Performance Materials, and Technology & Infrastructure. The Specialty Aditives segment includes powerful additives and versatile crosslinkers. The Nutrition & Care segment provides products for human well-being and the quality of life. The Smart Materials segment includes businesses with innovative materials that enable resource-saving solutions and replace conventional materials. The Performance Materials segment brings together businesses with the same DNA and it focus on resource-saving production, new applications and specialties. The Technology & Infrastructure segment provides services which are required across the asset lifecycle of chemical production plants. The company was founded in 1919 and is headquartered in Essen, Germany.


Trade directly on the supercharts through our supported, fully-verified and user-reviewed brokers.


Frequently Asked Questions
The current price of EVKIF is 19.67 USD — it has increased by 1.14% in the past 24 hours. Watch Evonik Industries AG stock price performance more closely on the chart.
Depending on the exchange, the stock ticker may vary. For instance, on OTC exchange Evonik Industries AG stocks are traded under the ticker EVKIF.
Evonik Industries AG is going to release the next earnings report on May 8, 2024. Keep track of upcoming events with our Earnings Calendar.
EVKIF stock is 1.13% volatile and has beta coefficient of 0.69. Track Evonik Industries AG stock price on the chart and check out the list of the most volatile stocks — is Evonik Industries AG there?
EVKIF earnings for the last quarter are 0.43 USD per share, whereas the estimation was 0.28 USD resulting in a 55.00% surprise. The estimated earnings for the next quarter are −0.04 USD per share. See more details about Evonik Industries AG earnings.
Evonik Industries AG revenue for the last quarter amounts to 3.99 B USD despite the estimated figure of 4.19 B USD. In the next quarter revenue is expected to reach 4.27 B USD.
Yes, you can track Evonik Industries AG financials in yearly and quarterly reports right on TradingView.
EVKIF stock has risen by 1.14% compared to the previous week, the month change is a 1.14% rise, over the last year Evonik Industries AG has showed a 9.13% decrease.
EVKIF net income for the last quarter is −161.15 M USD, while the quarter before that showed −101.48 M USD of net income which accounts for −58.79% change. Track more Evonik Industries AG financial stats to get the full picture.
Today Evonik Industries AG has the market capitalization of 9.88 B, it has decreased by 0.56% over the last week.
Yes, EVKIF dividends are paid annually. The last dividend per share was 1.26 USD. As of today, Dividend Yield (TTM)% is 5.92%. Tracking Evonik Industries AG dividends might help you take more informed decisions.
Like other stocks, EVKIF shares are traded on stock exchanges, e.g. Nasdaq, Nyse, Euronext, and the easiest way to buy them is through an online stock broker. To do this, you need to open an account and follow a broker's procedures, then start trading. You can trade Evonik Industries AG stock right from TradingView charts — choose your broker and connect to your account.
EVKIF reached its all-time high on Dec 31, 2013 with the price of 41.25 USD, and its all-time low was 16.69 USD and was reached on Oct 5, 2022. View more price dynamics on EVKIF chart.
See other stocks reaching their highest and lowest prices.
See other stocks reaching their highest and lowest prices.
As of May 4, 2024, the company has 33.41 K employees. See our rating of the largest employees — is Evonik Industries AG on this list?
Investing in stocks requires a comprehensive research: you should carefully study all the available data, e.g. company's financials, related news, and its technical analysis. So Evonik Industries AG technincal analysis shows the buy rating today, and its 1 week rating is buy. Since market conditions are prone to changes, it's worth looking a bit further into the future — according to the 1 month rating Evonik Industries AG stock shows the neutral signal. See more of Evonik Industries AG technicals for a more comprehensive analysis.
If you're still not sure, try looking for inspiration in our curated watchlists.
If you're still not sure, try looking for inspiration in our curated watchlists.
We've gathered analysts' opinions on Evonik Industries AG future price: according to them, EVKIF price has a max estimate of 26.68 USD and a min estimate of 18.14 USD. Watch EVKIF chart and read a more detailed Evonik Industries AG stock forecast: see what analysts think of Evonik Industries AG and suggest that you do with its stocks.
EBITDA measures a company's operating performance, its growth signifies an improvement in the efficiency of a company. Evonik Industries AG EBITDA is 2.77 B USD, and current EBITDA margin is 11.22%. See more stats in Evonik Industries AG financial statements.