FTMUSDT: Bearish TrendFTMUSDT is trading in PRZ, having bearish divergence on RSI, we can anticipate the change of trend and after the break of HL, we will short it.
FTMUSDT trade ideas

Strong uptrend, FTM I don't think It will give you a chance to buy in a big retracement.
It doesn't look like touch the low again and check the support(Yellow line)
so you can set buy on here and set a stop-loss appropriately.
Trend is so bullish that it will touch weekly resistance zone.
There is a difference from other altcoins.

🔥 FTM: Huge Reversal Possibility From Major SupportFTM has been trading in a very strong bullish trend since October of last year. This analysis is based on the idea that FTM will keep trading alongside the bottom purple support.
I'm waiting for a minor sell-off towards the entry, or when the price hits the bottom support line. Target at 2$ and the stop below the most recent local low.
The stop is very tight. If you prefer a higher probability trade (but lower RR) put the stop at 0.54

💡📈 "FTM Coin Analysis: Trends & Opportunities" 🚀🔍🔍 Let's conduct an in-depth analysis of the esteemed cryptocurrency, FTM, and identify our potential setups in the lower timeframes.
📊 In the weekly timeframe, contrary to the majority of coins, FTM has broken free from its prolonged weekly range after approximately 600 days, advancing towards the significant resistance level of 1.0950. This bullish movement was corroborated by an increase in volume, affirming the trend.
🔻 Upon encountering this resistance and with sellers re-entering the market, red candles reappeared, driving the price down to 0.6326. Nevertheless, this decline was marked by a reduction in volume, which underscores the robustness of our upward trend, suggesting that this may merely be a pullback to the weekly range.
🧐 I delved deeper into the nature of such movements to ascertain the underlying causes. It appears that traders who liquidated their holdings at the resistance and now observe FTM's commendable upward trajectory are motivated to reacquire their positions at the same price levels, thus transforming the previously breached resistance into a pivotal support through their buy orders.
📉 Now, let's shift our focus to a lower timeframe for futures trading analysis. For short positions, our support is well-defined, and upon breaking the critical support at 0.6326, we can initiate a short position aligned with our 4-hour trend. However, it is imperative to confirm the increase in volume at the time of the break.
⚠️ Given the significance of the 0.6326 support, if we notice volume rising as we approach this level and the RSI nearing oversold territory at the 30 line, you can also set a stop-sell order to capitalize on any sharp movements.
🔄 For a long position, we currently lack a clear trigger, but considering the weekly movement, we can hypothesize that this support may serve as a reversal point. Nonetheless, we will refrain from acting until we receive confirmation. For a riskier long position, we will await the 0.7300 level, and for a more secure long position, we will wait for a break above 0.7838.
🪙 In today's market, your trades should be closely aligned with Bitcoin's movements, given that BTC.D (Bitcoin Dominance) commands a significant portion of the market. Essentially, Bitcoin dictates the supports and resistances on the charts of other cryptocurrencies.
❌ Consequently, it is advisable that if altcoin support and resistance levels are breached but Bitcoin does not provide confirmation, you should enter positions with reduced risk. For instance, if FTM loses the 0.6323 support but Bitcoin maintains support at 60706, FTM is likely to hit its stop loss. However, if Bitcoin loses its support, FTM is poised for a more substantial decline, potentially yielding significant profits.
⏳ At present, we do not have an entry point for repurchasing this coin. Exercise patience and explore other projects during this period. Additionally, you might consider examining the DeFi space within the Fantom chain.
📊 Our upcoming support levels are 0.5472, 0.4903, 0.4380, with the resistances at 0.7300, 0.7838, and 0.9096.
😊 If you'd like me to analyze a specific coin or currency pair, be sure to comment so that I can allocate the next analysis for you!
⚠️ Also, please remember that I'm just an analyst, and this isn't financial advice. We're here to stay in the market and maximize profits by adhering to risk and capital management principles.

Trade Idea for FTMUSDTThe crypto market is in a general uptrend so we can expect coins to rally until BTC reverses. BTC had a slight retrace, bringing alts down to a key support zone. FTM is now within said support and is preparing for a rally as BTC is recovering from its retracement.

FTMUSDTI have spotted an interesting formation on this crypto pair. I believe we should go short now.
Please feel free to comment :)

On the right strong support | Long BiasOn 4h TF
FTM is creating a candle long wick on the support so I think FTM can bounce back from this support, just wait confirmation
Time will tell

#FTM/USDT#FTM
The price is moving in a bearish channel on the 12-hour frame and is largely sticking to it
We have a green support area at 0.5500 that is expected to be bounced from due to its strength
We have a trend to hold above the Moving Average 100, which is strong support for the rise
We have very strong oversold resistance on the RSI indicator to support the rise with a strong uptrend
Entry price is 0.7500
The first target is 0.9797
Second goal 1.09
Third goal 1.22

FTM USDTFTM logo on the price channel looks exactly like the FET currency and has a positive rise in halving.
Buying areas marked in orange, or buy in stages, and it is not necessary for the currency to reach exactly the box specified below

FTM LongPosted this one a bit late here but we are long on FTM.
Backtest of key ice line is a massive indicator. Within the triangle also above the demand line suggests strength.

FTM Turns BullishTrading Alpha is giving bullish signals across the board on many altcoins and FTM is one of my favorites. We have grey dots after a grey tear drop and grey arrow and a squeeze shade. Very, very clear. Now we are trading above support with the trackline turning green and curling up.
My target is $1.22, the highs.
If it comes, a dip to test support around .80 could be a solid entry with great risk reward.
Long position shows on chart.

$FTM Possible Double BottomKUCOIN:FTMUSDT - Huge Double Bottom possibly in print
Measured move +40%
Divergence at support in 0.635 levels would be preferred entry provided entry trigger activates via candlestick or candle stick formation.
Neckline break and retest at 0.78 level will provide further impetus for initial Target to 0.94.
Remember UPCOM:FTM can go higher can is dragged around like all altcoins by the ring master $BTC.
Always having Plan A and Plan B scenarios so we can react once the markets provide an opportunity to execute our edge.
If you liked this idea or if you have your own opinion about it, write in the comments.
The information and publications are not meant to be, and do not constitute, financial, investment, trading, or other types of advice or recommendations.

FTM About To Start New Bullish Trend 📈 The Price Perfectly Breakout From The Main Trend Line And Pullback Above It, Currently There Is a Nice Bounce From The Pullback Area And Its a Sign Of The New Bullish Trend
👉 Expect a Bullish Move Toward a 1.1$ And 1.4$ As a Next Targets

FTM-USDTftm currency is in an ascending channel with a strong ascending channel that we expect to break the ceiling of the channel and continue its upward movement.

Chart Idea - FTMUSDT Swing LongFTMUSDT broke out from it's long bull flag. There are 3 confirmations which lead me to open this long trade.
Bounced
- from the 0.786 fib level
- from upward diagonal support
- from the diagonal support which was the resistance last year in Feb 2023
Entry: 0.76
TP: 1.95
SL: 0.618
It's a swing trade and could take weeks to play out. Will keep on updating on this thread.

FTM: Keep an eye on this level! If you're looking to trade FTM at the moment, here's a quick setup that you might find helpful!
The idea is: Buy when the price breaks above 0.734$ and take profits at the levels shown in the chart.
Targets:
1. 0.748$
2. 0.784$
3. 0.82$
-------------------------------------------
About our trades:
Our success rate is notably high, with 10 out of 11 posted trade setups achieving at least their first target upon a breakout price breach (The most on TW!). Our TradingView page serves as a testament to this claim, and we invite you to verify it!

FTMUSDT 27 May 2024Fantom is changing it's momentum to bullish !
4H and 1H time frames are Bullish !
So , It's time to Buy FTMUSDT and Make some money!

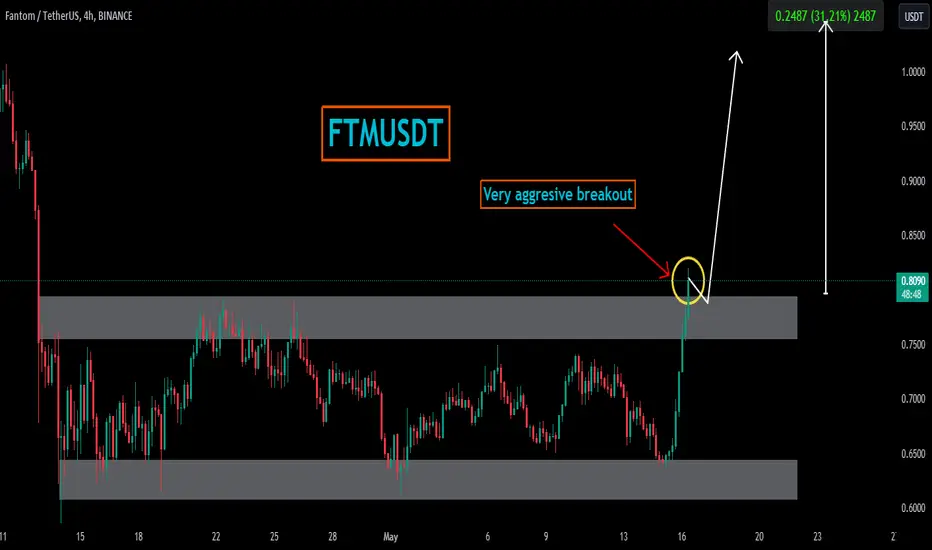
FTMUSDTFTMUSDT was being accumulated from couple of weeks and was traded in range bound.
later buyers took the charge and decided to put it in clear direction and has given breakout of range tight market.
Breakout is seems very strong and if this breakout sustains then the next upside target could be
1.05 which is decent 30%.
just an IDEA !!!!!!In the zoomed-out view on the 1D and 4H charts, we are in an upward channel. On the 1D chart, we have already hit the middle line, which is acting as resistance. Same Within this channel in 4H, we were in a range area that we broke out of on the upside. I believe we have already hit the target of this range area, which is exactly at the middle line of the 1D uptrend channel. Now, based on the RSI and a small support line, I think it is possible to form a small head and shoulders pattern. If this pattern forms, we could follow its target to go back down, aligning with the Fibonacci retracement levels of 50-61.8%. This would bring us back to our support line, where we can then observe how the price reacts.

FTMUSDT UPDATE #FTMUSDT (Update)
Hey all friends and traders. Hope you are enjoying our analysis. we are here to analyze FTMUSDT today.
Running in 15%+ profit .
Expecting more in coming days🚀📈

FTMUSDT IDEAHey traders hope you are enjoying our analysis. Now we are here again with a new trading opportunity. We will discuss today about FTM
FTM SO far So Good Moving Towards Targets Running In +20% Profit So Far Expecting More

📊#FTM may have completed daily level correction✔️🧠After completing the daily level target, we made adjustments corresponding to the cycle. At present, the price has returned to the support zone and then stopped. We can pay attention to the buying opportunities in the daily level buying zone. The probability of rebounding from here is relatively high. If we can break through the short defense point after the rebound, it means that we will continue to break through the previous high with a high probability. If the previous high is successfully broken, then we can see the optimal target area of 2.2909- 2.9455🙏🎯✔️
➡️It is reasonable to continue to hold some spot stocks.
Let's see👀
🤜If you like my analysis, please like 💖and share it💬
💕 Follow me so you don't miss out on any signals and analyze 💯

FTMUSDT IDIA Hello traders hope you are enjoying our Analysis.
Now we are here again with a new trading opportunity ,we will discuss today about FTMUSDT
Falling Wedge Breakout Has Already Done Expecting Massive Bullish Wave In Coming Days Expecting 30-35% Bullish Wave.
