Inverse head and shouldersSupport around 7.5 has been holding up and we've been seeing a continuation off the fib bounce.
21P trade ideas

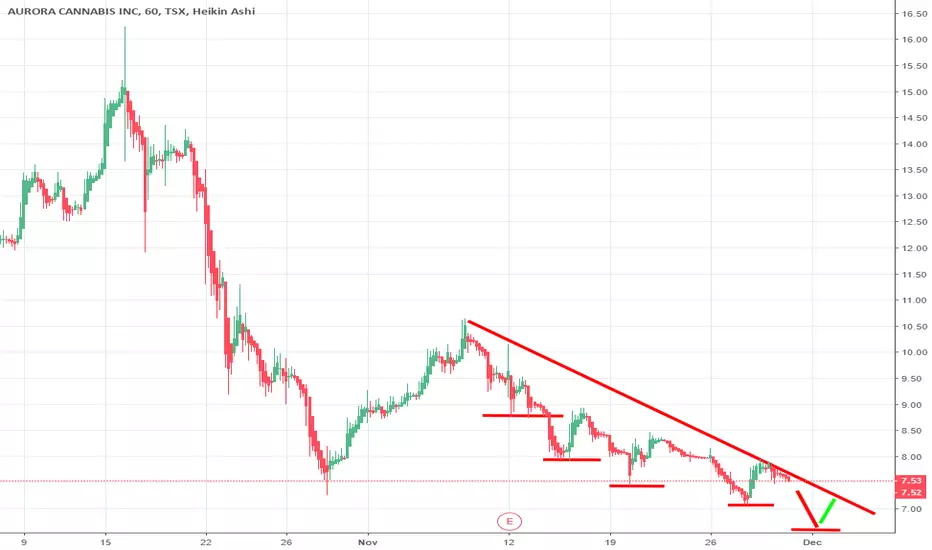
ACB watching for potential of daily lower high being setACB enjoyed a nice oversold bounce the past two days, now we're watching the high and low of Friday to break to signal consolidation or continuation.


My ACB pattern remains the same for months!!!This is simply beautiful. I have the same patterns, resistance, and support outlined since September 2018. Lower ascending blue line is the lower portion of the ascending triangle I have outlined. ACB hits 6.19CAD at low and climbs back up with a rising sun candle pattern. It's possible that we see a reversal pattern from here. I wouldn't be surprised if we see a short squeeze first as means of a shake out before we take off. I just bought some shares today. Still dollar cost averaging my way through ACB because I can see there's another final support level below it, which is 5.00-5.34 CAD. I doubt we will hit this level because the ascending triangle has been confirmed twice at the bottom and the top. If we hit 5.0-5.34 CAD, this level would only be reached via a shake out. Im putting most of my capital in this level if it ever happens. I LOVE this GAME!!!!!!!
I'm a strong believer of ACB. I believe that they will lead the Cannabis market one day.
I am Balanar the night stalker. I stalk these charts day and night!!!!

ACB loses key weekly levelACB had a clear bear break today, and there is a lot of space before next supports are encountered. Bears are in full control

New Bottom?So I thought that the bottom was around $6.50-$6.40, but I was wrong. I have a bad history with bottoms (no pun intended). The bottom may be around $6.25-$6.20. Again, I could be wrong, but I am still watching.......One person said the bottom is around $6.10. We shall see.


Waiting on the BounceSo I have been watching ACB, and I have been waiting on the bounce with this one. It looks like the bounce could happen around $6.50-$6.40. It might hit this area tomorrow and bounce mid market. I just don't want to catch a falling knife. I will be watching this one for sure. Good luck tomorrow.

going back to a few dollarsIf you look at monthly graph, it looks like the perfect asset bubble.
Predict it will go back to 2-3 dollars within 2019.

ACB testing key support first thing; lack of support if breaksACB has a key test of support first thing tomorrow, and there's a lack of support near by should the chart see a bear break


Possible Day Trade Monday?So check this out. I have been paying close attention to this stock, and it is on a downward trend of course. I still see opportunity to make a quick day trade on Monday or Tuesday. I will watching for a quick get in a get out. Good luck out there guys.


ACB searching for support above the low of OctoberACB is positioned weak with a potential daily bear flag.
Key short term levels:
S: 7.92
R: 8.93

ACB - What's next for Aurora?Dear Traders,
ACB has been showing ups and downs the last couple of days. Earnings showed growth but a lot of investors were skeptical and that was seen in the price action.
First I'd like to start about the vol indicator on this Chart.
It shows a potential Curve, which would mean that we in exactly at the lowest point of the curve, low volume, not a lot of buying power, but not a lot of selling power either.
On the chart you see that i've drawn a big green line, that represents the bull's breakout line. if the bulls manage to push it above that line it could create a potential run to a higher resistance point, which, if that was the case, the bulls would have to break the resistance at our 55 day moving average (55 MA) located at 8.86C$, if they succeed, price action would likely go to around 9.25C$ (100 MA) and 10.58C$ after that (200 MA).
The other scenario is me thinking about that Curve previously discussed. If we were indeed at the lowest point, that means votality would be low. One thing I do know is that price drops faster than it goes up. So keeping that in mind, ACB could also drop lower.
Our Support are is located around 7.93C$. Bulls need to manage to keep the price above it in order to stay bullish. If they fail, we might see a drop to around 7.24C$.
Let's see how this will playout on Monday.
Keep your eyes on the charts!
If you have any questions or any thoughts, feel free send me a PM or to comment on this TA!
If you'd like to join my Discord Channel to talk about stocks, share knowledge and have a laugh then please send me a PM so that I can link you to it!
Take care!

