$ACB 1 hour IH&SInverse head and shoulders on 1hr and 4hr
Above $7.54 and it moves to $8ish pretty wuick with a volume gap above
In the 8/13 $7.5c
21P trade ideas

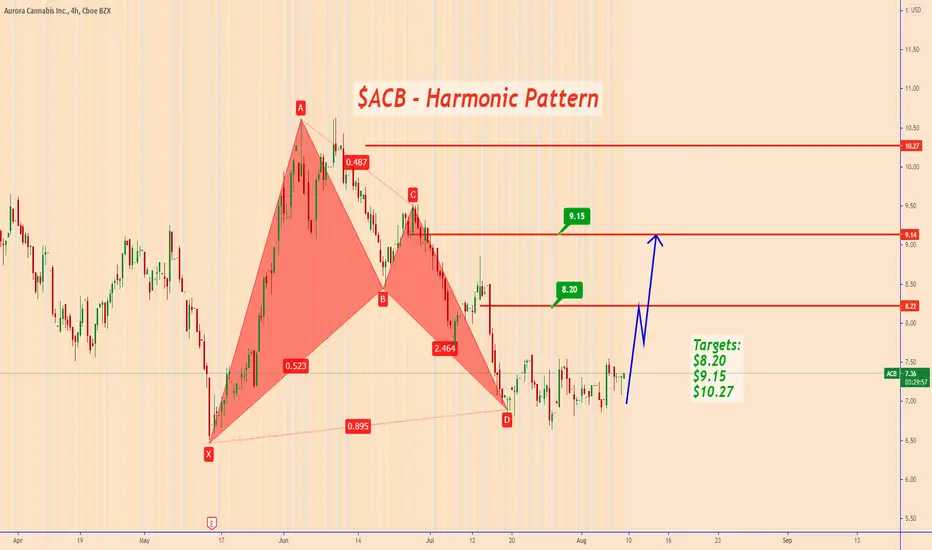
ACB: This Is Still a Valid Bullish SetupThe price ended this harmonic bullish pattern on July 19-21 and it has been almost 1 month now that the price is in correction. Part of this issue is also the summer season which is adding to its normal effect. From here we can see a strong upward movement in the following days. So do not despair for cannabis companies :)
Targets:
$8.20
$9.15
$10.27
Thank you and Good Luck!
Pot dog ACB may have found a bottomACB is a horrible company and one of my least favorite in the pot sector. That being said, technically it's looking healthier after testing and holding the $6.70 range a number of times and re-capturing the short-term MA (8EMA). Keep an eye on this for a break of the short-term trendline.

$ACB Target 12.88 for 33.26% (77% from here)$ACB Target 12.88 for 33.26%
Or next add at 6.63 (Support)
I also bought some cheap 7$ calls here… literally just 2 because I don’t know how to trade options yet LOL. (Options people help me out 🤣 ) So LET’S GO…
-----
—
On the far right of the chart is my Average (Grey) Current Target (Green), and Next Level to add (Red) Percentage to target is from my average.
ONLY ADD at support levels & FIB levels… labeled
I start every position with .5 - 1% of my account and build from there as needed and as possible.
I am not your financial advisor. Watch my setups first before you jump in… My trade set ups work very well and they are for my personal reference and if you decide to trade them you do so at your own risk. I will gladly answer questions to the best of my knowledge but ultimately the risk is on you. I will update targets as needed.
GL and happy trading.

Aurora Cannabis Bull Run 36 USDAfter a long 5 wave downward movement which ended on 29 October 2020, Aurora fought itself back with an ABC upward correction on 30 November, it followed an ascending pennant with approx. 15 USD wärend during a 5 wave upward movement its goal had. Wave 5 ended on 11 February 2021 and it followed a renewed 5 wave downward movement to 17 May 2021.
This was followed by an ABC upward correction followed by a 5 wave downward movement which ended on 20 July.
Since then Aurora is in a range and runs into the top of a triangle formation.
If the price would break out upward from the triangle, a Bullische SKS would be at approx. 19.54 in the confirmation and would have as a goal 36.06 USD
Short alternative on a downside breakout from the triangle, I would see 5.34 as the next support for further upside moves and thus set my target for a short position at 5.50.
RSI Neutral 45.77
CCI 20 -8.93 Neutral
MACD Crosses Bullish from the lines
Vortex diverges Bullish
EMAS 20 50 200 Currently active as resistance

ADDED to $ACB Target 12.78 for 33.26% $ACB Target 12.78 for 33.26%
Or next add at 6.63
This is starting to look pretty bullish… if it goes down to 6.63 I will definitely double there. Up till now I’ve been adding a little at a time, but that support is a double level for sure…
-----
—
On the far right of the chart is my Average (Grey) Current Target (Green), and Next Level to add (Red) Percentage to target is from my average.
ONLY ADD at support levels & FIB levels… labeled
I start every position with .5 - 1% of my account and build from there as needed and as possible.
I am not your financial advisor. Watch my setups first before you jump in… My trade set ups work very well and they are for my personal reference and if you decide to trade them you do so at your own risk. I will gladly answer questions to the best of my knowledge but ultimately the risk is on you. I will update targets as needed.
GL and happy trading.

AcbGot a pretty solid bear flag or sideways consildation. Seems to love to jump from 6.85-754. If it broken above and held 756 could be a play but got to expect it’s headed back to 685 just keeping an eye on it

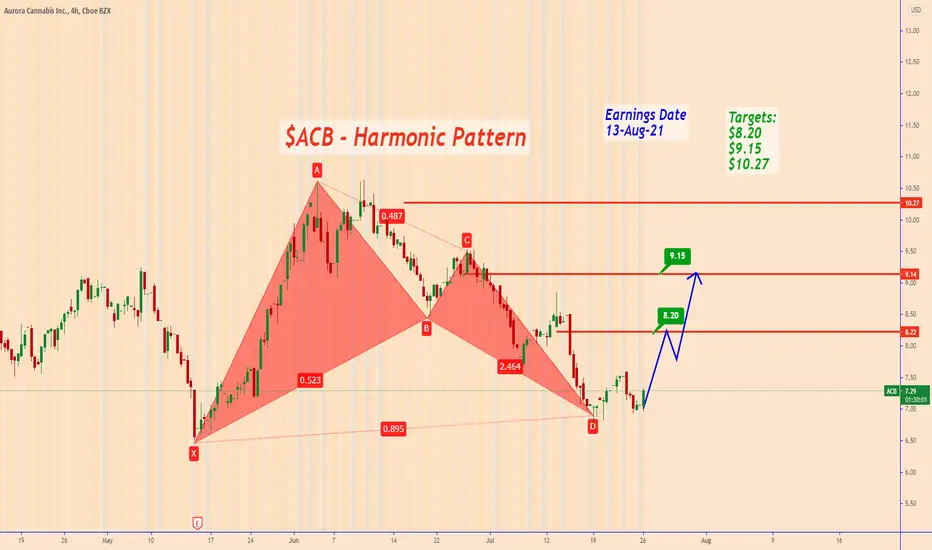
$ACB: Buy The Harmonic PatternACB completed a beautiful harmonic pattern. Now the probability is very high that we may see the price moves higher.I have set 3 targets because the price may not drop again after the summer season. On the other hand, the cannabis industry is waiting for the government to pass the cannabis legalization law in many U.S. countries.
I don't want to rely on earnings for this trade as they will be negative as it is expected from the market.
Earnings Date
13-Aug-21
Targets:
$8.20
$9.15
$10.27
Thank you and Good Luck!
🟢 Added to $ABC Target 12.90 for 32.85% 🟢 $ABC Target 12.90 for 32.85%
Or double position at 6.52
I added here because it bounced off of support… if it hits support again (6.52) I will double my position. It's about time that cannabis stocks go for a run...
-----
—
On the far right of the chart is my Average (Grey) Current Target (Green), and Next Level to add (Red) Percentage to target is from my average.
Numbers with an A are places that are a good idea to add if you can.
Numbers with a D are places where you should double your position.
I start every position with .5 - 1% of my account and build from there as needed and as possible.
I am not your financial advisor. Watch my setups first before you jump in… My trade set ups work very well and they are for my personal reference and if you decide to trade them you do so at your own risk. I will gladly answer questions to the best of my knowledge but ultimately the risk is on you. I will update targets as needed.
GL and happy trading.

+600% in 1 year, was sleeping on ganja wave BTLRY is another good ganja stock but I see ACB outperforming it. the best ones are penny stocks for ganja easy +1,000%
whatever you do dont miss the buy at the green line. the new gold rush/ black gold (oil)

ACB retest 5dllsI think ACB will go down to 4 ~ 5 dlls,
Last time ACB touches a strong support around 7dlls, it went up but it couldnt break for multiple days the resistance at in the area of 10.3, it also already went back to the new support at 9dlls and doesnt look 9dlls will hold it, MACD doesnt send me a signal is time to buy and RSI is going down but still the oversold signal is far from come.
Let me know your toughs guys, this is my first post, I bough put options.


ACB - D1 :: Short Target - Resistance RegionBuying suggestion as it is in the support region. My ideal take profit $19.

ACB: inverse head and shoulders formingIs weed hot again?
Potential inverse head and shoulders on ACB forming on daily. The pattern will only be confirmed if we break 19.
Initial target on the chart.
So what do you think? Are we forming this left shoulder or not?

Aurora Canabis Inverse Head and Shoulders PatternAurora Canabis appears to be completing the formation of the second shoulder of an inverse head and shoulders pattern on the weekly chart. Current price $9.92 Usd ... Target price $45-$50 usd

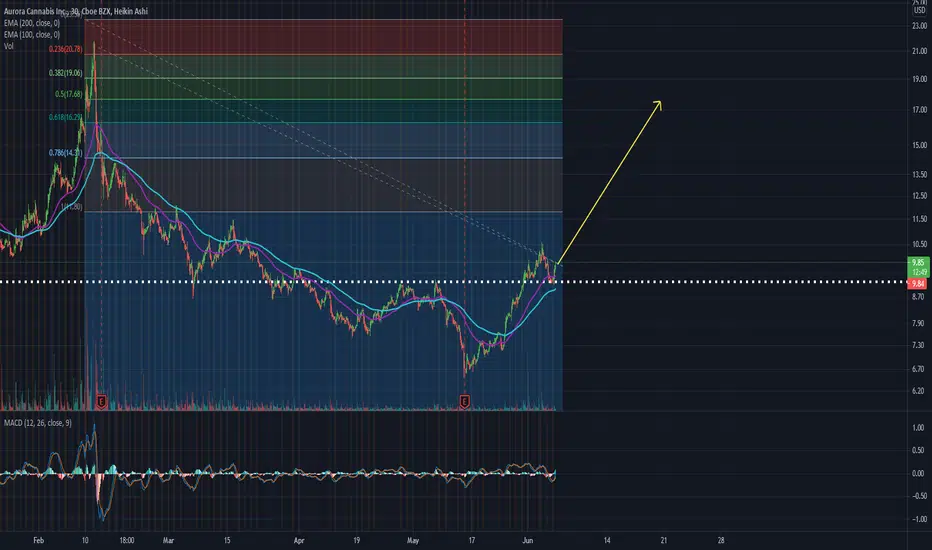
ABC nice bounceABC bounced on 9$ again - perfect.
If we ride on the 100 EMA next target will be 14$ then 17.60$. Overall there is an started uptrend.
Aurora'ing back to life..will ACB burn one to get a yearly HIGH?EMA cross (50/200) on the 2hr chart, maybe back testing the 200 EMA now. Bresserts crossover on the weekly chart in oversold territory (last time this happened, it pumped $10 in the following 2 weeks - past performance not necessarily indicative of future results).
CMF shows money flow is in positive territory, relative strength hovering just under 50 RSI. I'd like to see the price touch the $8.80-9.00 ideally, but the downside can be complete here. Semi-worst case it should hold $8.00 but still would not invalidate until major support is breached. Good R:R IMO... this one can be a volatile beast. It is possible we see a pump to the $10.90 region and a retrace to these levels again ($8.50-$9.50) before moving higher. Placing major support at $7.20, soon to move up to $7.60. Keep in mind this is the one traded on the NASDAQ in USD, so you'd have to convert support regions accordingly if trading on the TSX exchange chart. Inverted H&S formation points to $21-$23 region... but should go 'HIGH'er long term.


ACB vs AHTcan we guess the future?
IMO if you want to play this, use a tight stop loss !really tight!, and WAIT for the volume before entering the trade.
if we have no volume, it is less possible that we see a trend reverse

