Long if we hit targets next weekGoing long IF we see targets next week. Do to the ETF re-balancing
7.10 strong support tested 4 times on Daily chart from 27July-01Aug as Resistance.
And has been acting as support/resistance since December 2017 numerous times.
21P trade ideas

Hard to say whats going on with ACBWith the all bullish rally's in the sector ACB has been left behind due to almost 1 billion shares. Companies are Cron in my opinion are worthless are making new highs. ACB finding huge selling pressure in the 9's including myself. ACB looked like it was going to break out yesterday we had a bullish flag and the rally to 9.35 followed by huge mark sells pushing acb back to the 200 day moving average. soo what's next? could find support around 8.15 and rally but I don't think so I am thinking one more leg down mid 7's and rally and test 12.5 by December. their are better stocks out there. people are selling acb and buying into aphria and canopy. I wouldn't be buying acb until it hits 9.5 and buying into the momentum. or id be a buyer under 7.15. its a sketchy short due to the momentum of the sector but the momentum of the TSX is saying we should be going lower.
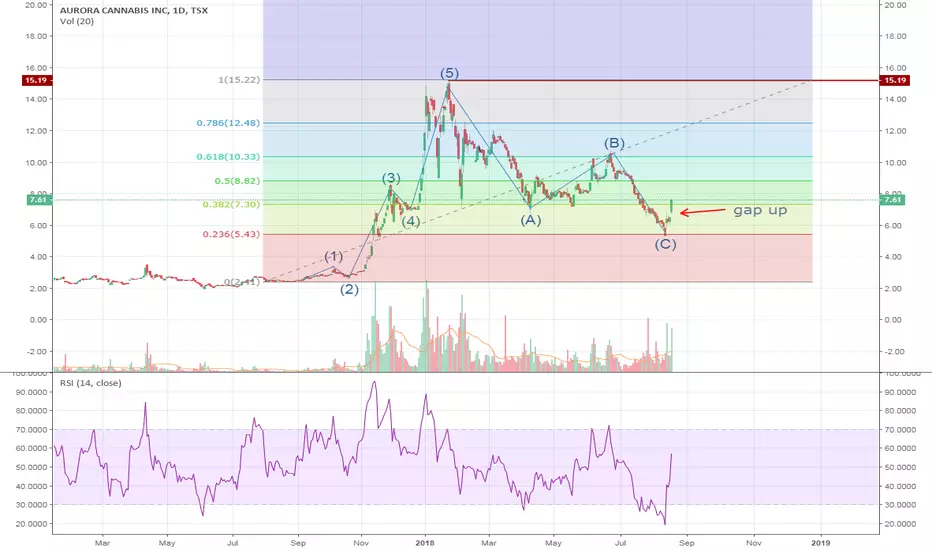
Elliot Wave's on AuroraSince I am fairly new to technical analysis, I like to theory craft using different methods. As I am attempting Elliot waves, this is a projection I have come up with in regards to the price action of Aurora. Projecting the the creation of new highs using psychological levels as support/resistance. Viewing on the daily chart is more accurate to start the wave count. Expecting the formation of a head and shoulders at the top.


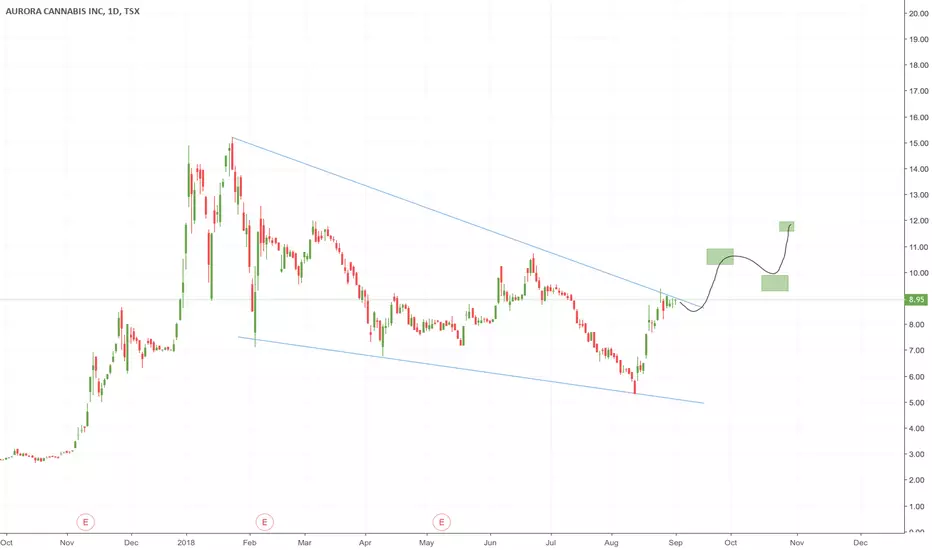
TSX:ACB likely to see some more consolidation before surging upUnless some serious news breaks soon, I think the price could fall more before surging up into legalization.
Use your own judgement before investing and always use a stop-loss.


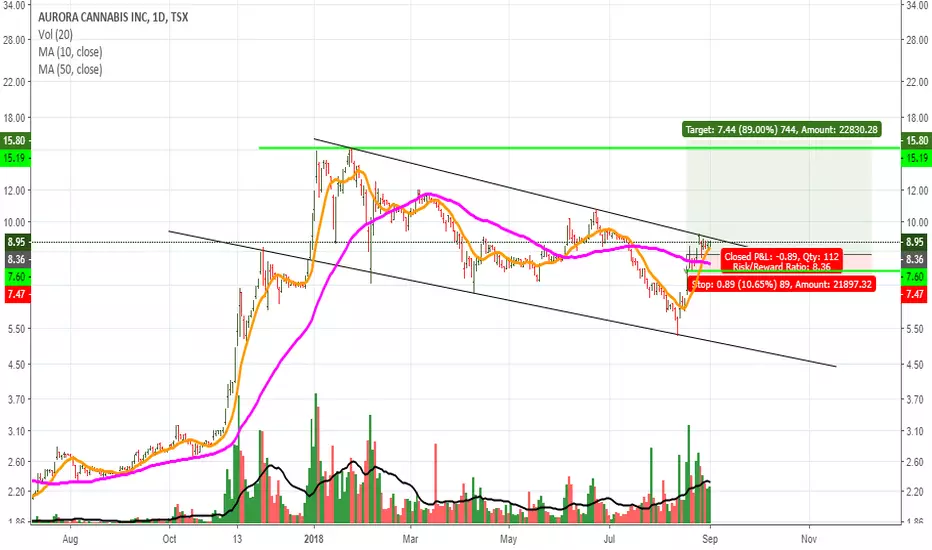
Long update (TSX)looks to be potentially breaking out of a few month downtrend. lagging other cannabis stocks. trigger: 9.39 to add $CGC $CRON $MJ

ACB Bullish Descending Wedge formationACB is forming a descending wedge on the daily & weekly. I prefer the second upper limit because it has more touches, and would consider the breakout a fakeout since the next day closed back within pattern. I'd also consider the lower trendline violation a fakeout as well for the same reason. This pattern should remain valid so long as 5.29 holds IMO

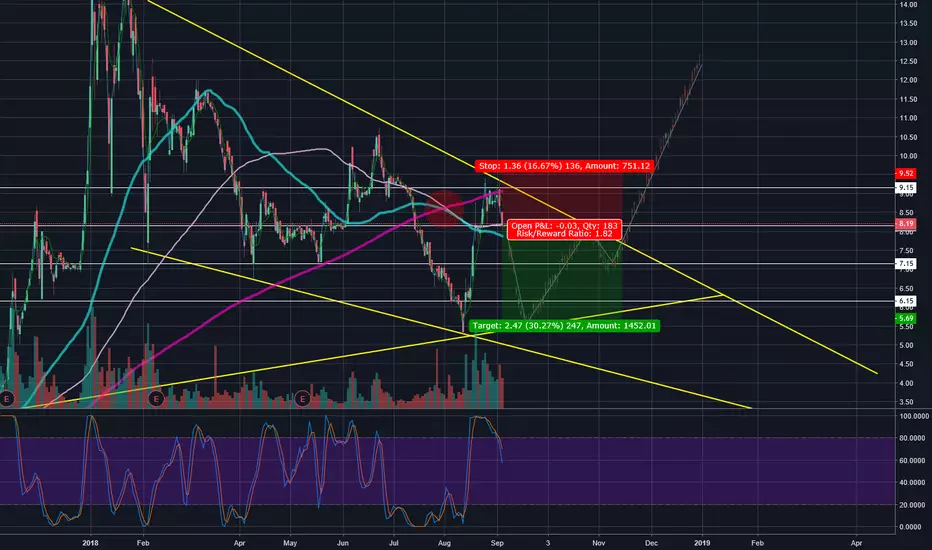
ACB long and bumper road to 10 bucks.No one can predict what the market is going to do.
But for my amusement, assuming the equal measured moves repeat themselves.
We won,t see much over 10 bucks by profit-taking season. (Nov/Dec).

beautiful fib bounceThis additionally proves that 24% fib is a thing as first shown in the hempco graph linked. Also looks to have completed ABC correction which could ultimately be a bullish signal. look for a good buying opportunity around 6.75 (I might enter higher manually) when it tries to fill that gap from 6.50 to 6.88.
ACB, 3Mo chart, Broken the trendACB. has broken the downtrend and is now positioning itself for an uptrend. Based on the Fibonacci retracement, we should be seeing north of $7.00 in the coming days/weeks.
P.S: This is personal opinion, and is for educational purposes

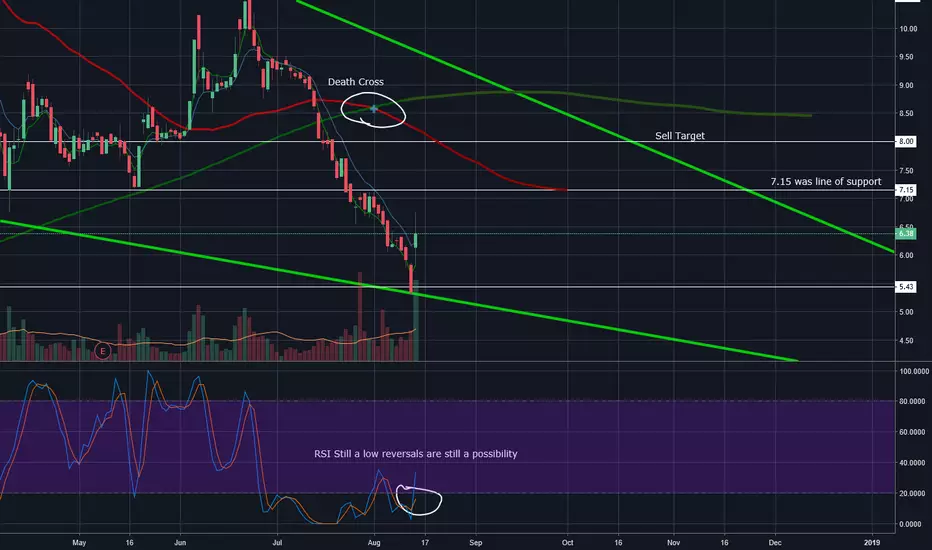
Weed RallyThe death cross is staring us in the face! stocks usually start a horrible down trend after you see this and that's why acb broke support at call it 7.15 stocks on downtrends never really become too overbought so acb seems like a chart I would stay away from. my opinion is see acb testing the back side of the 50 day moving average at around 7.15 I honestly don't see it breaking it right away but ACB has a mind of its own. 8 bucks will be the real big test interesting to see if ACB gets above the 50 to test the 200 maybe by October see over 8.00 again. IF ACB break out of this downtrend a massive short squeeze will be in affect and we could see 12 by December. my predictions these stocks change on the daily as you can see. Ill probably chart out canopy because its a way better stock to trade. easier to make money. happy trading

Sold $5.58 Yesterday for 3% loss. Re-Entering TomorrowRisky swing trade, but I think this reaction is just panic selling from the news yesterday. A lot of people are holding a bag right now, so when the news hit they freaked out. A lot of new traders attracted to weed stocks. It was also hovering around $3.00 before they made all those acquisitions
The volume was unspectacular relatively speaking. Funds have already unloaded a lot of stock at this point, which you can see on the two big volume days that happened just recently -- one day for 30 million, the other 20 million.
Like the risk reward. I may hold, but if I'm up nicely, I might sell too. Depends on a lot of factors whether I hold.
Buying the dip or the open depending on the price action. Will be scaling into my position nonetheless. If it closes strong, I'll fill. No buy half this time, filling the whole thing today

Buying 1/2 PositionLooks pretty oversold here. I'll explain later because i don't have time/ I had a chart previously made up but I must have deleted the drawings

ACB may retest low before next bullish run.Its possible we will see some weakness and a few retests of lows.
Perhaps some nice buying zones ahead before the run to October 17th.

$ACB buyers are searching for a cheaper entry - dilution is goodWhile TSX:ACB is sitting at a new support of $7 - buyers are looking for a new avenue while production lags behind the Oct 11th date.
While FOMO locks into place we will see a new entry around $5.50 and maybe as low as $4 before the new year and before production starts.
LEAFers are still waiting for new shares.
Dilution is good.

Large descending wedge. been waiting to find support at 6.00 there to confirm my theory on a large descending wedge from recent highs. you can see the pattern so don't rush into a buy. buy when there is blood on the streets like yesterday, on or near the button line. use stop losses these bears are strong. when trading don't get greedy :)

Clear Buy Signal - Fake Out at 6.28 - Strong Bullish Reversal IBAll indicators are extremely oversold, MACD showing bearish sentiment, however, we believe this to be a fakeout. Expect a strong Bullish reaction week ending. We expect bullish break up to 8.30 - 8.55 per share. The need for reassessment will be performed once certain price points reached.

ACB Broke Support Heading LowerACB broke a key support line at 7.11, will probably head lower to 5.21.
