AUD trade ideas

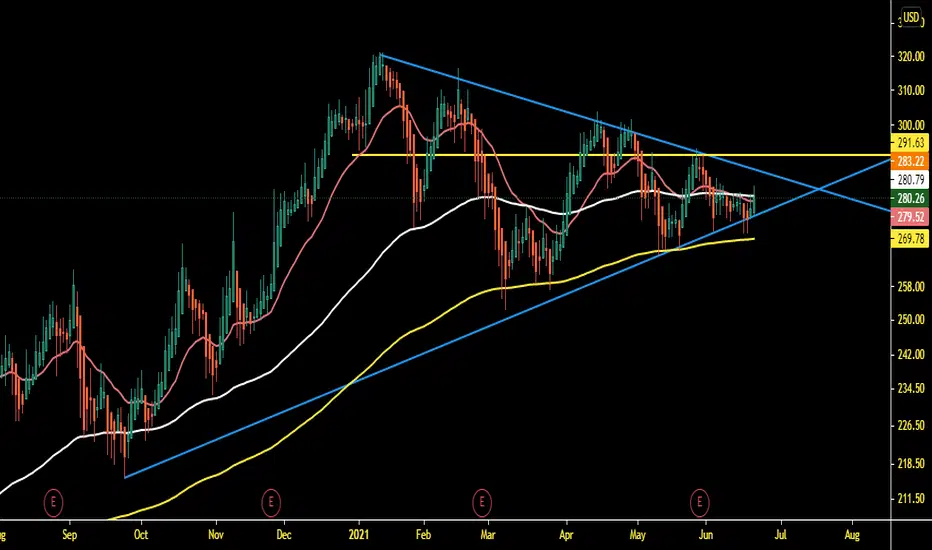
Symmetrical TriangleLooks to have broken to the upside.
Possible stop below upper trendline somewhere inside the triangle, or just below bottom trendline of triangle depending on your risk tolerance.
No recommendation.
Trade Idea: Buy Autodesk Inc (ADSK)At current levels or better we consider ADSK a buy/long.
Out of it’s last 10 quarterly earnings reports, 9 has exceeded analyst’s consensus expectations.
Profile: A multinational software corporation that makes software products and services for the architecture, engineering, construction, manufacturing, media, education, and entertainment industries.
As per the company’s Q1 presentation:
First Quarter Fiscal 2022 Financial Highlights
Total revenue increased 12 percent to $989 million;
GAAP operating margin was 14 percent, down 1 percentage point;
Non-GAAP operating margin remained flat at28 percent;
GAAP diluted EPS was $0.70; Non-GAAP diluted EPS was $1.03;
Cash flow from operating activities was $336 million; free cash flow was $316 million.
“An acceleration in new business, solid execution, and a resilient subscription business model delivered a strong start to the new fiscal year,” said Andrew Anagnost, Autodesk president and CEO. “As the world rebuilds after the pandemic, Autodesk’s purpose – a better world designed and made for all – has never been more important, and underpins our confidence this year and well into the future.”
“Momentum in our end markets and customer adoption of cloud services is building,” said Debbie Clifford, Autodesk CFO. “We are raising our FY22 revenue guidance to reflect a partial year contribution from acquisitions and remain on track to achieve our FY23 financial goals.”
According to 3Dprintingindustry.com: “On Autodesk’s earnings call, its CEO Andrew Anagnost explained how the firm has benefited from “waning uncertainty” and “growing confidence in its end markets.” “An acceleration in new business, solid execution, and a resilient subscription business model delivered a strong start to the new fiscal year,” said Anagnost.”
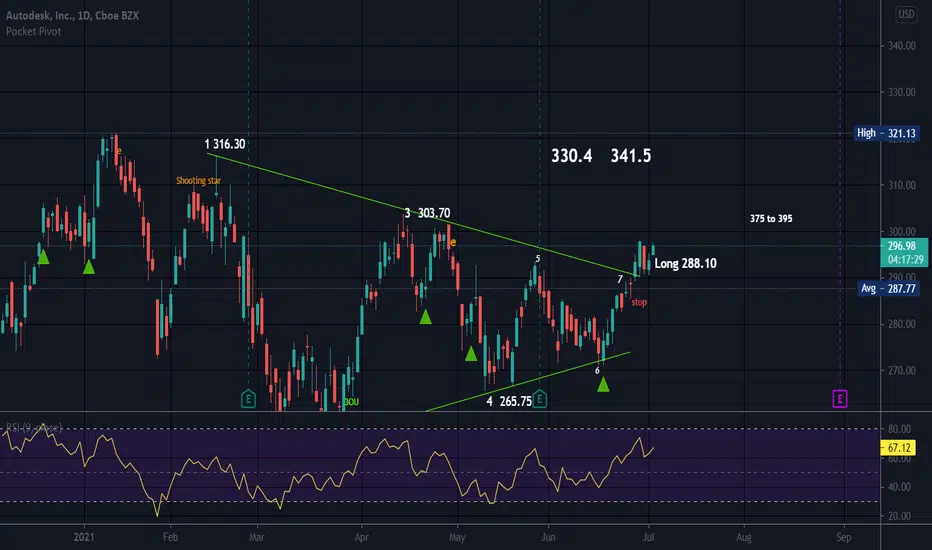
Technical Review: Year-to-date, the share has traded in a consolidation range, peaking at $320.94 before testing a low of $252.60 on 08 March. Over the last two trading sessions, the price has cleared it’s downward trend line extending back to the YTD peak, with strong candle structure and a regaining of it’s pivot. Also note, the 14-day RSI is breaking to the upside of it’s multi-month base.
Preferred Trading Levels
Buy ADSK at current levels ($297.74) or better (buy range: $294.00/297.00)
Stop-loss: $285.40
Target Range: $315.00-$321.00
Pre-Market Price: $296.46


ADSK: 200-day acting as major supportThe 200-day may be acting as some major support.
Bullish MACD crossover supports the bullish trend.
RSI leaves enough room for further upside price potential.
Above 276 supports a bullish trend.


ADSK Daily Potential BreakoutNASDAQ:ADSK potential breakout with MACD confirmation.
Stop loss around $270.


$ADSK with a Bullish outlook following its earnings #Stocks The PEAD projected a Bullish outlook for $ADSK after a Positive over reaction following its earnings release placing the stock in drift B
If you would like to see the Drift for another stock please message us. Also click on the Like Button if this was useful and follow us or join us.

Long term uptrend untouched, set to new ATH this year.Please note this is just an idea, invest at your own risk.
Autodesk is clearly in an uptrend long-term, however has been trading in a range for the past half year.
It recently touched the 200MA, which has been a stable support historically for the stock.
Avoid buying if it breaks 275 level of support.
I think the current 293 can be a good entry, although an alternative entry around 305 can be a safer play.
If it moves up strongly over 305, I expect it to test ATH at 322.
Happy to get feedback on my idea.

AutoDesk...Carving out a short term bottom ?A confluence of an ABCD and a Harmonic Bat Pattern may signal a short term reversal.
Suggested Entry,Targets and Stop are marked.
Definitely the broad market and particularly the tech space must stabilize.
As always DYODD
S

Symmetrical TriangleSymmetrical Triangles are a neutral pattern until a trendline is broken in one direction or the other.
Price is consolidating inside of the triangle and will break one way or the other as a rule.
No recommendation. The next touch will be touch 5.

ADSK approaching breakout levelADSK approaching breakout level. Would love to see some consolidation either under this downtrend line, or below 304 for a move back to the ATH. An inside day would beautiful!

Ichimoku entry ADSKTrigger this time is the lagging span, least common of the 4 triggers but also the most successful among the trades where i've been tracking that.
My current settings are still:
9/26/52/26/13/52/0.5/0.1/0.5/5

ADSK TestBullish if ADSK breaks this resistance around 270-275. An infrastructure bill would benefit ADSK, it's performing relatively well against the rest of the NASDAQ and QQQ. Senator transaction included ADSK recently too. Included in ARK's new Space ETF. Currently facing selling pressure from the rest of the tech rotation, therefore could outperform a lot of other tech names if a tech run occurred.
Bear case is the current tech rotation, and it could continue in it's current downtrend if it rejects the 270-75 resistance which will likely depend on how the rest of tech/nasdaq/spy do.
Overall I am watching this one for a breakout past 275 with a possible upside to around 300.

ADSK 🌦Would you look at that! A lower degree correction that looks like a copy paste of the higher degree correction. Some people use RSI for signals I prefer to use fractals. A stock is like a person, we tend to judge people based on personality and conduct. The personality aspect pertains to the fundamental analysis and the conduct relates to technical analysis. The two components don't always align. Some argue that FA is dominant others like myself argue that technical analysis is the way to go. If I had to pick only one it would be TA.

Gartley pattern on ADSK. Next target is 280.46 ( T1)Gartley pattern on ADSK. Next target is 280.46 ( T1)
