FPMB trade ideas


$FCX Short, breakdown below support w/ bear marketIf the market continues lower from passing below the 50MA on Friday then I will be watching FCX for a short during the breakdown below $10.30 support level. This is mirroring the market being that it has also crossed below the 50MA, will be watching the market to see my move on this one.


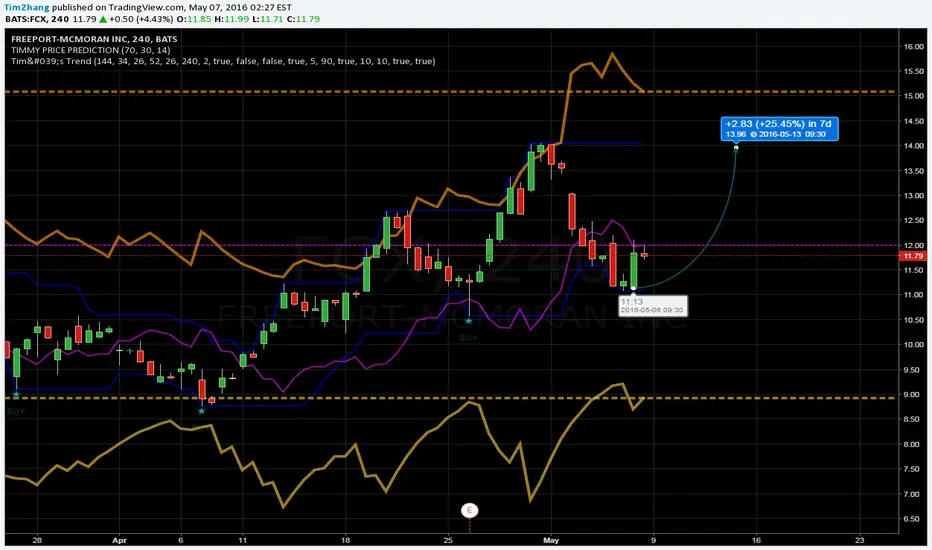
$fcx confirm 1hr buy signalconfirm buy signal, reloading from my $11.34 buy signal, buying these dips


$fcx $32 per share by Mid 2017added to my long term holdings today based off Inverse Head & Shoulders pattern


Freeport-McMoran possible trajectoryLong term I'm bullish but if we can get a lift in USD and see metal take a dip we could be looking at a near term high. In an ideal world we bounce up to fill gap at 13 and then roll over and drop back to $5 levels. Tough to believe it could take such a battering but those gaps are there to be filled. One to watch this week.

Inverse Head & Shoulders on $fcxShort term bearish w/ confirm sell signal on daily chart. looking to re-enter below $9


Long at spot, bullish ABCDFreeport MCMoran has formed a nice bullish ABCD.
Reaching target 1 of $25 very soon. 100% upside potential.

Best trade for last week's review, Long FCXthanks to the rally of gold and silver, FCX flied! there are still a lot of upside potential for this stock.
Good luck to all!

FCX - Bearish signals failedI always look to short or buy around value, depending on the preceding trend. On FCX, I have been looking for a short.
On the daily chart, a class A bearish divergence formed, right at value on the weekly; that is a great bearish signal. However, price failed to close below 11.50$, thus never confirming the divergence. Today, there was a very nice bounce, turning the impulse green and making a new swing high.
Whenever such bearish signals fail, it is almost always a good idea to go long; same thing applies to failing bullish signals.
I am looking for FCX to reach the strong resistance area at 17$.

FCXExtreme selloff for this name ,
Price rallied of the extension. now testing monthly resistance.
I spotted an inverse H/S supporting a bullish case.
I can see price retesting supports,
Buy or sell the break out


pennies to thousands above cloud above 200 daily ma metals mininstrong group use our entry rules in our book rbi strong macd about to cross stoc crossed cci and percent r pvt strong always have stop loss orders always diversify use our money management tips

Recap and update on FCXNYSE:FCX
My update for FCX,
I mentioned this stock as an idea for short. the trade is a daily trade, the stock is still weak.
Stock is forming now what's called mashroum over shape or in other hands H&S shape
The stock hits the resistance at point (A) and the low of point (B) both are strong resistance , we might see an upthrust tomorrow meaning making new high and close near the low. If we see the upthrust that will confirm on the daily the stock is in distribution phase.

Stock that could earn you big profits. FCX ShortNYSE:FCX
The chart is very descriptive,You can see the start of selling to the herd on the left at point A.
Point B is the confirmation forming an up thrust bar with high volume, this is big money selling to the herd.
And this confirms the stock is weak.
The stock then drops in a down channel and changed behavior below the EMA's
Notice at point A the low of this wide range bar will act as a resistance because of the high volume combined with it.
Today at point C the stock tagged that low from below, and closes as a no demand bar (narrow spread, close in the mid up bar with low volume) there is no chance to break above the low of point A with such low volume.
The stock now in a down trend with weakness in the back ground from A and B.
The no demand at C confirms a very strong sell signal in such conditions.

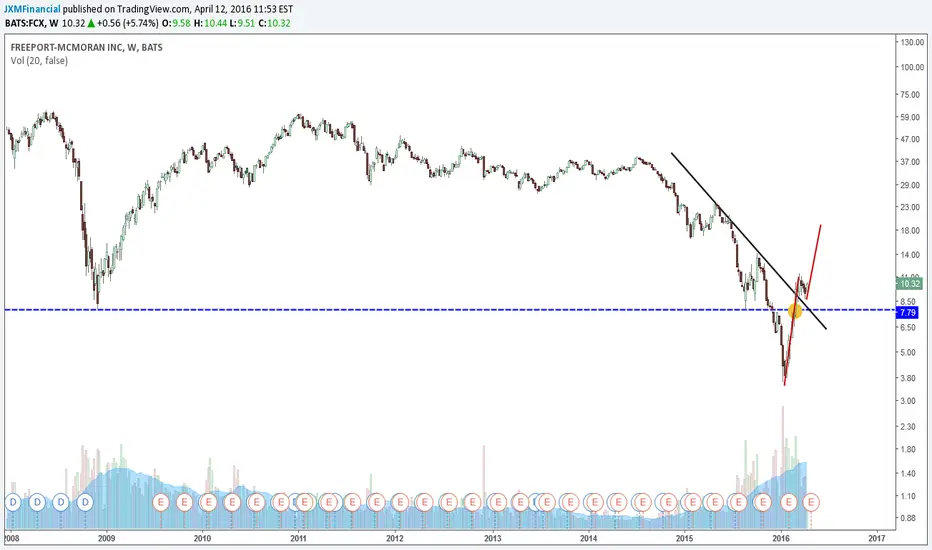
FCX - test of 200 MA.FCX came off its low in February, it is now digesting gains and could retrace further. I am watching price behaviour around this critical zone 7.83USD - 8.00USD.
