PCG caught my attention to continue bullishI want to Buy this Stock base on 2 main approach.
1.Technical Analysis: base on technical, using the ICT I trade with, The market sweeps liquidity and create a valid order blocks and expanded with Fair value gaps, target equal highs, this is good sing of strength to go bullish.
2. FOUNDAMENTAL REP
Next report date
Report period
Q2 2024
EPS estimate
0.27EUR
Revenue estimate
5.49 BEUR
1.056EUR
2.04 BEUR
22.13 BEUR
2.01 B
About Pacific Gas & Electric Co.
Sector
Industry
CEO
Patricia K. Poppe
Website
Headquarters
Oakland
Employees (FY)
28.01 K
Founded
1995
FIGI
BBG000FMW945
PG&E Corp. operates as a holding company, which engages in generation, transmission, and distribution of electricity and natural gas to customers. It specializes in energy, utility, power, gas, electricity, solar and sustainability. The company was founded in 1995 and is headquartered in Oakland, CA.

PCG is putting in a BasePCG is oversold in RSI at 36 and the MCAD is beginning to show a slow down. A base seems to be building on the daily with volume. The news of the new leadership position has hit the market and the stock has broken below the 200 day MA.
The Time Frame Continuity is not showing the best promise; how

PG&E corp is in for an ELECTRIC RIDE UPWARDSPG&E isn't going anywhere, California is helplessly dependent on it. they are investing in their infrastructure (after its horrendous wildfire fiasco due to infrastructure negligence). This situation lead to a tremendous sell-off because it seemed like a risky company to hold stocks for and overall

$PCG with a Bearish outlook following its earnings #Stocks The PEAD projected a Bearish outlook for $PCG after a Positive over reaction following its earnings release placing the stock in drift B with an expected accuracy of 33.33%.

PCG: Can utilities stand the bears?PG&E Corporatio n
Short Term - We look to Buy at 12.25 (stop at 11.57)
Price action has formed an expanding wedge formation. This is positive for sentiment and the uptrend has potential to return. Support is located at 12.00 and should stem dips to this area. Preferred trade is to buy on dips.

$PCG with a Neutral outlook following its earnings #Stocks The PEAD projected a Neutral outlook for $PCG after a Positive Under reaction following its earnings release placing the stock in drift A with an expected accuracy of 80%.
$PCG with a Neutral outlook following its earnings #Stocks The PEAD projected a Neutral outlook for $PCG after a Positive Under over reaction following its earnings release placing the stock in drift A with an expected accuracy of 75%.
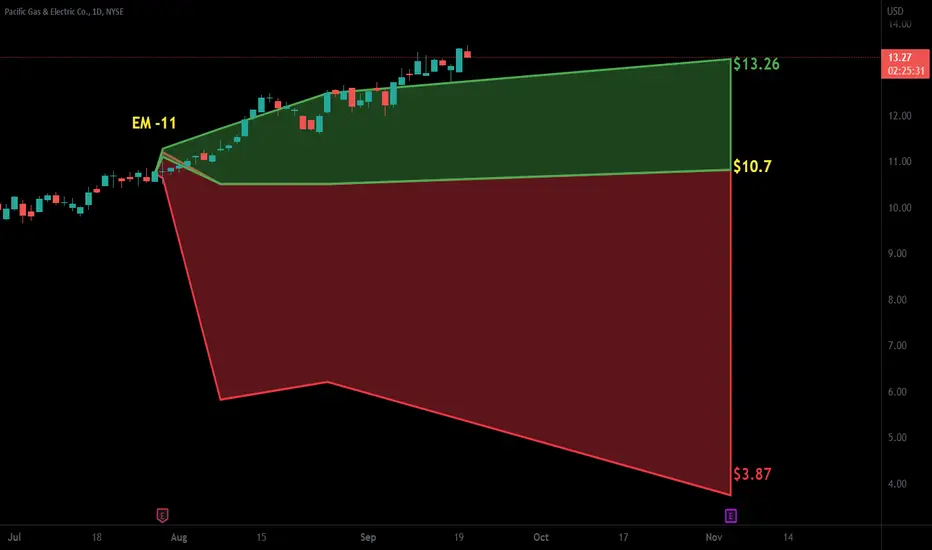
can it break extreme resistance?PCG seems like it wants to breakout soon, but lets wait for a clear break past 13.28 first, after that we can target 14.26-15.59-16.92

PCG Trending UPRates going up and expecting price action too as well.
The DAILY EMA's are fully supporting the price; targeting the 200 Wkly EMA next.
Appears to be a Cypher (Gartley) pattern in play; where we start we finish.
Do your own research; and enjoy every sandwich EES.
Comments welcome.

Still Green on Pacific Gas and Electric. PCGA respite of some sort that is looking to be very temporary. A very tenuous picture and very dependent on how exactly the markets will open on Monday. Be careful and remember: Markets can never truly be timed. Fibtime is at best a very flimsy tool.
We are not in the business of getting every predic

See all ideas
Trade directly on the supercharts through our supported, fully-verified and user-reviewed brokers.


Curated watchlists where PCG is featured.

Frequently Asked Questions
Depending on the exchange, the stock ticker may vary. For instance, on FWB exchange PG + E CORP. stocks are traded under the ticker PCG.
PG + E CORP. is going to release the next earnings report on Jul 25, 2024. Keep track of upcoming events with our Earnings Calendar.
PCG earnings for the last quarter are 0.43 EUR per share, whereas the estimation was 0.41 EUR resulting in a 2.90% surprise. The estimated earnings for the next quarter are 0.32 EUR per share. See more details about PG + E CORP. earnings.
PG + E CORP. revenue for the last quarter amounts to 6.38 B EUR despite the estimated figure of 5.16 B EUR. In the next quarter revenue is expected to reach 6.11 B EUR.
Yes, you can track PG + E CORP. financials in yearly and quarterly reports right on TradingView.
PCG net income for the last quarter is 681.19 M EUR, while the quarter before that showed 836.25 M EUR of net income which accounts for −18.54% change. Track more PG + E CORP. financial stats to get the full picture.
Yes, PCG dividends are paid quarterly. The last dividend per share was 0.01 EUR. As of today, Dividend Yield (TTM)% is 0.12%. Tracking PG + E CORP. dividends might help you take more informed decisions.
Like other stocks, PCG shares are traded on stock exchanges, e.g. Nasdaq, Nyse, Euronext, and the easiest way to buy them is through an online stock broker. To do this, you need to open an account and follow a broker's procedures, then start trading. You can trade PG + E CORP. stock right from TradingView charts — choose your broker and connect to your account.
As of Apr 26, 2024, the company has 28.01 K employees. See our rating of the largest employees — is PG + E CORP. on this list?
We've gathered analysts' opinions on PG + E CORP. future price: according to them, PCG price has a max estimate of 20.51 EUR and a min estimate of 14.92 EUR. Read a more detailed PG + E CORP. forecast: see what analysts think of PG + E CORP. and suggest that you do with its stocks.
EBITDA measures a company's operating performance, its growth signifies an improvement in the efficiency of a company. PG + E CORP. EBITDA is 7.96 B EUR, and current EBITDA margin is 34.01%. See more stats in PG + E CORP. financial statements.