Breakout confirmed — going long on PNC.
Pattern: Breakout from triangle (pink lines)
Entry Zone: Around 197.89 (breakout level)
Stop Loss: Just below 197.15 (previous resistance/support)
Targets:
Target 1: 198.73 (first red resistance)
Target 2: 199.73 (top green line)
Next report date
—
Report period
—
EPS estimate
—
Revenue estimate
—
13 EUR
5.66 B EUR
32.73 B EUR
390.62 M
About PNC Financial Services Group, Inc. (The)
Sector
Industry
CEO
William Stanton Demchak
Website
Headquarters
Pittsburgh
Founded
1983
ISIN
US6934751057
FIGI
BBG000H0NN59
The PNC Financial Services Group, Inc. is a holding company, which engages in the provision of financial services. It operates through the following segments: Retail Banking, Corporate and Institutional Banking, Asset Management Group, and Other. The Retail Banking segment offers deposit, lending, brokerage, investment management, and cash management products and services to consumer and small business customers. The Corporate and Institutional segment covers the lending, treasury management, and capital markets-related products and services to mid-sized and large corporations, government, and not-for-profit entities. The Asset Management Group segment includes personal wealth management for high net worth and ultra-high net worth clients and institutional asset management. The company was founded in 1983 and is headquartered in Pittsburgh, PA.
Related stocks

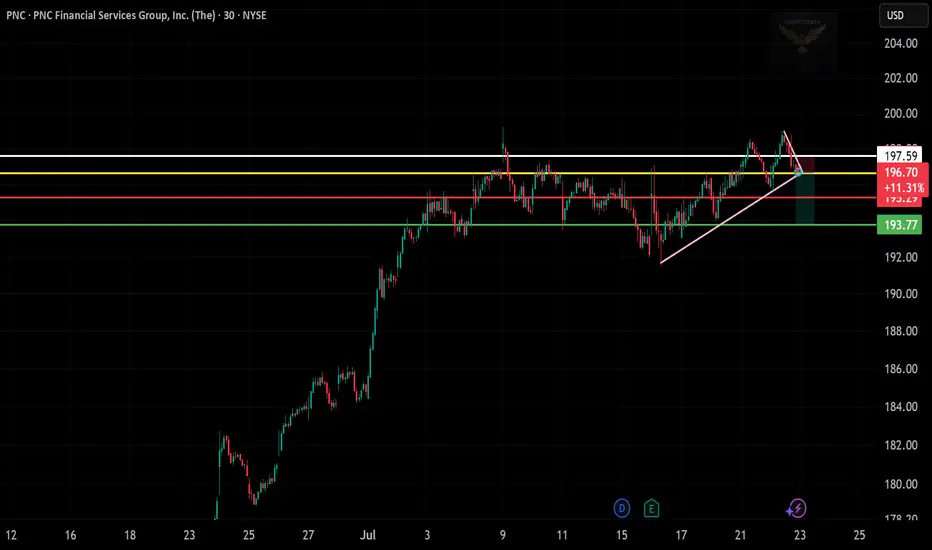
PNC – Short Trade!📌
Entry: 196.70
Target: 193.77
Stop: 197.59
Setup: Rising Wedge Breakdown
Bias: Bearish
PNC Financial Services Group, Inc.On the above weekly chart price action has corrected 50%. A number of reasons now exist to be long, including:
1) RSI resistance breakout.
2) Regular bullish divergence. Measured over 2-months.
3) A Double bottom prints.
3) Price action prints on the 100-week RMA with the divergence. Look left.

$PNC with a bullish outlook following its earnings #StocksThe PEAD projected a bullish outlook for NYSE:PNC after a positive over reaction following its earnings release placing the stock in drift B with an expected accuracy of 66.67%.

PNC The PNC Financial Services Group Options Ahead of EarningsIf you haven`t bought the dip on PNC:
Then analyzing the options chain and the chart patterns of PNC The PNC Financial Services Group prior to the earnings report this week,
I would consider purchasing the 125usd strike price Puts with
an expiration date of 2025-1-17,
for a premium of approximatel

PNC Financial Services Group Inc.: Decoding Insider MovesIn the dynamic world of finance, insider activity can often serve as a valuable indicator for investors seeking deeper insights into a company's health and potential future performance. Recently, PNC Financial Services Group Inc. ( NYSE:PNC ) caught the attention of market observers with a notable i

PNC The PNC Financial Services Group Options Ahead of EarningsIf you haven`t bought PNC here:
Then analyzing the options chain and the chart patterns of PNC The PNC Financial Services Group prior to the earnings report this week,
I would consider purchasing the 120usd strike price Puts with
an expiration date of 2024-3-15,
for a premium of approximately $8.7

Banking Segment Evolution. Hey TradingView. TiltonKy is bank to bring some new ideas for the quarter.
We are investing numerous positions, and a few we plan to share with trading view this quarter.
Firstly Banks.
"SVB Banking Crisis" has put a point and hold on the banking sector this year. Giving Financials a 2 year de

Earnings Journal 💵💵💵█ SIMPLISTIC ANALYSIS </
Current Market Trend: neutral/no defined trend.
Next Wave: buy wave to the deviation.
Next Swing: negative swing to support.
Trade Type: Touch & Go don't wait for a close.
█ EARNINGS AT A GLANCE </
Release Date: 10/13 BMO
Earnings Anticipations: positive surprise for EPS


See all ideas
Summarizing what the indicators are suggesting.
Neutral
SellBuy
Strong sellStrong buy
Strong sellSellNeutralBuyStrong buy
Neutral
SellBuy
Strong sellStrong buy
Strong sellSellNeutralBuyStrong buy
Neutral
SellBuy
Strong sellStrong buy
Strong sellSellNeutralBuyStrong buy
An aggregate view of professional's ratings.
Neutral
SellBuy
Strong sellStrong buy
Strong sellSellNeutralBuyStrong buy
Neutral
SellBuy
Strong sellStrong buy
Strong sellSellNeutralBuyStrong buy
Neutral
SellBuy
Strong sellStrong buy
Strong sellSellNeutralBuyStrong buy
Displays a symbol's price movements over previous years to identify recurring trends.
PNC4938166
PNC Financial Services Group, Inc. 2.55% 22-JAN-2030Yield to maturity
4.18%
Maturity date
Jan 22, 2030
P
PNC4659077
PNC Bank, National Association 4.05% 26-JUL-2028Yield to maturity
4.10%
Maturity date
Jul 26, 2028
P
PNC4899974
PNC Bank, National Association 2.7% 22-OCT-2029Yield to maturity
4.10%
Maturity date
Oct 22, 2029
PNC4861314
PNC Financial Services Group, Inc. 2.6% 23-JUL-2026Yield to maturity
4.04%
Maturity date
Jul 23, 2026
PNC5238031
PNC Financial Services Group, Inc. 1.15% 13-AUG-2026Yield to maturity
4.03%
Maturity date
Aug 13, 2026
PNC4822619
PNC Financial Services Group, Inc. 3.45% 23-APR-2029Yield to maturity
4.03%
Maturity date
Apr 23, 2029
PNC4497661
PNC Financial Services Group, Inc. 3.15% 19-MAY-2027Yield to maturity
3.99%
Maturity date
May 19, 2027
P
PNC4555139
PNC Bank, National Association 3.1% 25-OCT-2027Yield to maturity
3.95%
Maturity date
Oct 25, 2027
P
PNC4587608
PNC Bank, National Association 3.25% 22-JAN-2028Yield to maturity
3.82%
Maturity date
Jan 22, 2028
PNC5735839
PNC Financial Services Group, Inc. 5.3% 21-JAN-2028Yield to maturity
—
Maturity date
Jan 21, 2028
See all PNP bonds
Curated watchlists where PNP is featured.


Frequently Asked Questions
The current price of PNP is 154 EUR — it hasn't changed in the past 24 hours. Watch PNC Financial Services Group, Inc. stock price performance more closely on the chart.
Depending on the exchange, the stock ticker may vary. For instance, on FWB exchange PNC Financial Services Group, Inc. stocks are traded under the ticker PNP.
PNP stock has fallen by −1.89% compared to the previous week, the month change is a 3.31% rise, over the last year PNC Financial Services Group, Inc. has showed a −21.83% decrease.
We've gathered analysts' opinions on PNC Financial Services Group, Inc. future price: according to them, PNP price has a max estimate of 208.02 EUR and a min estimate of 175.09 EUR. Watch PNP chart and read a more detailed PNC Financial Services Group, Inc. stock forecast: see what analysts think of PNC Financial Services Group, Inc. and suggest that you do with its stocks.
PNP stock is 2.63% volatile and has beta coefficient of 1.09. Track PNC Financial Services Group, Inc. stock price on the chart and check out the list of the most volatile stocks — is PNC Financial Services Group, Inc. there?
Today PNC Financial Services Group, Inc. has the market capitalization of 60.58 B, it has decreased by −0.68% over the last week.
Yes, you can track PNC Financial Services Group, Inc. financials in yearly and quarterly reports right on TradingView.
PNC Financial Services Group, Inc. is going to release the next earnings report on Jan 16, 2026. Keep track of upcoming events with our Earnings Calendar.
PNP earnings for the last quarter are 3.71 EUR per share, whereas the estimation was 3.45 EUR resulting in a 7.53% surprise. The estimated earnings for the next quarter are 3.57 EUR per share. See more details about PNC Financial Services Group, Inc. earnings.
PNC Financial Services Group, Inc. revenue for the last quarter amounts to 5.04 B EUR, despite the estimated figure of 4.97 B EUR. In the next quarter, revenue is expected to reach 5.10 B EUR.
PNP net income for the last quarter is 1.53 B EUR, while the quarter before that showed 1.37 B EUR of net income which accounts for 11.50% change. Track more PNC Financial Services Group, Inc. financial stats to get the full picture.
Yes, PNP dividends are paid quarterly. The last dividend per share was 1.46 EUR. As of today, Dividend Yield (TTM)% is 3.69%. Tracking PNC Financial Services Group, Inc. dividends might help you take more informed decisions.
PNC Financial Services Group, Inc. dividend yield was 3.27% in 2024, and payout ratio reached 45.85%. The year before the numbers were 3.94% and 47.72% correspondingly. See high-dividend stocks and find more opportunities for your portfolio.
As of Nov 19, 2025, the company has 53.69 K employees. See our rating of the largest employees — is PNC Financial Services Group, Inc. on this list?
Like other stocks, PNP shares are traded on stock exchanges, e.g. Nasdaq, Nyse, Euronext, and the easiest way to buy them is through an online stock broker. To do this, you need to open an account and follow a broker's procedures, then start trading. You can trade PNC Financial Services Group, Inc. stock right from TradingView charts — choose your broker and connect to your account.
Investing in stocks requires a comprehensive research: you should carefully study all the available data, e.g. company's financials, related news, and its technical analysis. So PNC Financial Services Group, Inc. technincal analysis shows the strong sell today, and its 1 week rating is sell. Since market conditions are prone to changes, it's worth looking a bit further into the future — according to the 1 month rating PNC Financial Services Group, Inc. stock shows the neutral signal. See more of PNC Financial Services Group, Inc. technicals for a more comprehensive analysis.
If you're still not sure, try looking for inspiration in our curated watchlists.
If you're still not sure, try looking for inspiration in our curated watchlists.